## Line Chart: Accuracy Comparison Over Iterations
### Overview
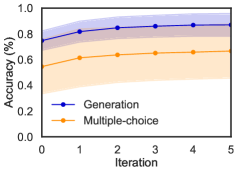
The image displays a line chart comparing the accuracy performance of two methods—"Generation" and "Multiple-choice"—across a series of iterations. The chart includes shaded regions around each line, likely representing confidence intervals or standard deviation.
### Components/Axes
* **Chart Type:** Line chart with shaded error bands.
* **Y-Axis:**
* **Label:** "Accuracy (%)"
* **Scale:** Linear, ranging from 0.0 to 1.0 (representing 0% to 100%).
* **Major Ticks:** 0.0, 0.2, 0.4, 0.6, 0.8, 1.0.
* **X-Axis:**
* **Label:** "Iteration"
* **Scale:** Linear, discrete integer values.
* **Major Ticks:** 0, 1, 2, 3, 4, 5.
* **Legend:**
* **Position:** Bottom-right corner of the chart area.
* **Entries:**
1. **Blue line with circle marker:** "Generation"
2. **Orange line with circle marker:** "Multiple-choice"
### Detailed Analysis
**Data Series 1: Generation (Blue Line)**
* **Trend:** The line shows a clear upward trend, with the steepest increase occurring between iterations 0 and 1. The rate of improvement slows after iteration 2, approaching a plateau.
* **Approximate Data Points:**
* Iteration 0: ~0.75 (75%)
* Iteration 1: ~0.82 (82%)
* Iteration 2: ~0.85 (85%)
* Iteration 3: ~0.86 (86%)
* Iteration 4: ~0.87 (87%)
* Iteration 5: ~0.87 (87%)
* **Shaded Region (Blue):** Represents the uncertainty or variance for the "Generation" method. The band is widest at iteration 0 (spanning roughly 0.65 to 0.85) and narrows significantly as iterations increase, indicating more consistent performance.
**Data Series 2: Multiple-choice (Orange Line)**
* **Trend:** This line also shows a consistent upward trend, but starts from a lower baseline and maintains a lower accuracy than the "Generation" method at every iteration. Its growth appears more linear and gradual.
* **Approximate Data Points:**
* Iteration 0: ~0.55 (55%)
* Iteration 1: ~0.62 (62%)
* Iteration 2: ~0.65 (65%)
* Iteration 3: ~0.67 (67%)
* Iteration 4: ~0.68 (68%)
* Iteration 5: ~0.69 (69%)
* **Shaded Region (Orange):** Represents the uncertainty for the "Multiple-choice" method. This band is also widest at the start (spanning roughly 0.45 to 0.65 at iteration 0) and narrows over time, though it remains slightly wider than the blue band at later iterations.
### Key Observations
1. **Performance Gap:** The "Generation" method consistently outperforms the "Multiple-choice" method by a significant margin (approximately 15-20 percentage points) across all iterations.
2. **Convergence:** Both methods show diminishing returns, with accuracy gains slowing after iteration 2 or 3. The "Generation" method appears to converge to a higher final accuracy (~87%) compared to "Multiple-choice" (~69%).
3. **Uncertainty Reduction:** For both methods, the variance in performance (indicated by the shaded bands) decreases substantially with more iterations, suggesting the methods become more stable and predictable.
4. **Initial Advantage:** The "Generation" method starts with a much higher accuracy at iteration 0, indicating a stronger initial performance or better "zero-shot" capability.
### Interpretation
The chart demonstrates a clear superiority of the "Generation" approach over the "Multiple-choice" approach for the task being measured. The data suggests that the "Generation" method is not only more accurate from the outset but also learns or improves more efficiently in the early iterations.
The narrowing confidence intervals imply that with more iterations (or more data/training), both methods become more reliable, but the "Generation" method achieves high reliability faster. The persistent gap between the lines indicates a fundamental difference in the efficacy of the two methods for this specific task, rather than a temporary or easily closed advantage.
From a technical perspective, this could imply that generative models (if that's what "Generation" represents) are better suited for this problem domain than discriminative or selection-based ("Multiple-choice") models. The chart provides strong evidence to favor the "Generation" method if the goal is maximizing accuracy and achieving stable performance with fewer iterations.