## Line Graph: Accuracy Comparison Across Iterations
### Overview
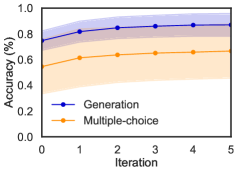
The image depicts a line graph comparing the accuracy of two methods—**Generation** (blue line) and **Multiple-choice** (orange line)—across five iterations (0 to 5). Both lines show upward trends, with shaded regions indicating variability or confidence intervals. The y-axis represents accuracy as a percentage (0–100%), while the x-axis denotes iteration steps.
---
### Components/Axes
- **X-axis (Horizontal)**: Labeled "Iteration," with markers at 0, 1, 2, 3, 4, and 5.
- **Y-axis (Vertical)**: Labeled "Accuracy (%)," scaled from 0.0 to 1.0 (equivalent to 0%–100%).
- **Legend**: Located in the **top-left** corner, with:
- **Blue line**: Labeled "Generation."
- **Orange line**: Labeled "Multiple-choice."
- **Shaded Regions**: Light blue (Generation) and light orange (Multiple-choice) bands around each line, likely representing confidence intervals or error margins.
---
### Detailed Analysis
1. **Generation (Blue Line)**:
- **Trend**: Steadily increases from ~0.75 (75%) at iteration 0 to ~0.85 (85%) at iteration 5.
- **Data Points**:
- Iteration 0: ~0.75 (±0.05, based on shaded region).
- Iteration 1: ~0.80 (±0.04).
- Iteration 2: ~0.83 (±0.03).
- Iteration 3: ~0.84 (±0.03).
- Iteration 4: ~0.85 (±0.02).
- Iteration 5: ~0.85 (±0.02).
- **Shaded Region**: Narrows slightly over iterations, suggesting reduced uncertainty.
2. **Multiple-choice (Orange Line)**:
- **Trend**: Gradual increase from ~0.55 (55%) at iteration 0 to ~0.65 (65%) at iteration 5.
- **Data Points**:
- Iteration 0: ~0.55 (±0.06).
- Iteration 1: ~0.60 (±0.05).
- Iteration 2: ~0.62 (±0.04).
- Iteration 3: ~0.63 (±0.04).
- Iteration 4: ~0.64 (±0.03).
- Iteration 5: ~0.65 (±0.03).
- **Shaded Region**: Remains relatively wide, indicating higher variability.
---
### Key Observations
1. **Performance Gap**: The Generation method consistently outperforms Multiple-choice by ~10–15 percentage points across all iterations.
2. **Convergence**: Both methods plateau near iteration 4–5, with Generation stabilizing at ~85% and Multiple-choice at ~65%.
3. **Uncertainty**: The shaded regions for Generation narrow over time, while Multiple-choice’s variability remains relatively constant.
---
### Interpretation
- **Method Efficacy**: The Generation method demonstrates superior accuracy, likely due to iterative refinement or adaptive learning mechanisms. Its steeper slope suggests faster improvement compared to Multiple-choice.
- **Stability**: The plateau in both methods implies diminishing returns after iteration 4, indicating potential limits to their effectiveness.
- **Confidence Intervals**: The narrowing shaded region for Generation implies increasing confidence in its results, whereas Multiple-choice’s wider bands suggest less reliability.
- **Practical Implications**: Generation may be preferable for tasks requiring high accuracy, while Multiple-choice could serve as a baseline or fallback. Further investigation into why Multiple-choice plateaus could reveal constraints in its design.
---
### Spatial Grounding & Verification
- **Legend**: Top-left, clearly associating colors with labels.
- **Color Consistency**: Blue (Generation) and orange (Multiple-choice) match legend entries exactly.
- **Axis Alignment**: X-axis (iterations) and Y-axis (accuracy) are orthogonal, with no overlapping labels.
---
### Content Details
- **No Text Blocks**: The image contains no standalone text blocks, tables, or embedded diagrams.
- **Visual Hierarchy**: Lines and shaded regions are the primary focus, with minimal gridlines or annotations.
---
### Final Notes
The graph highlights the iterative advantage of the Generation method, emphasizing its robustness and adaptability. The Multiple-choice method’s performance suggests it may rely on static heuristics or limited contextual understanding. Further analysis of the underlying algorithms could clarify these trends.