\n
## Line Chart: Surprisal vs. Training Steps
### Overview
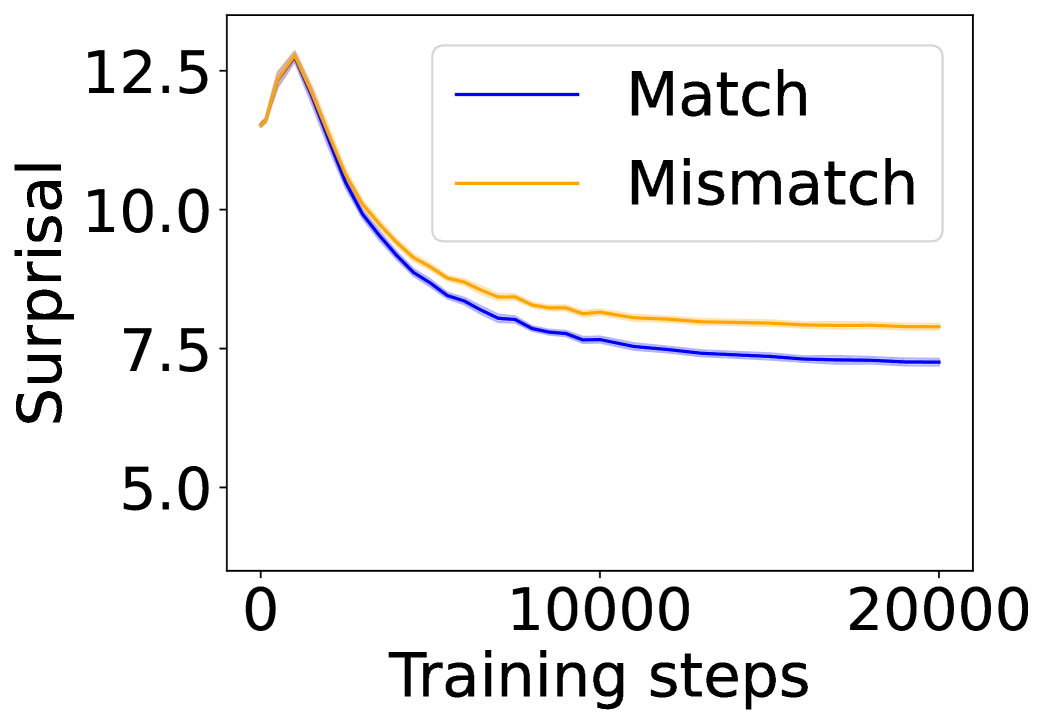
The image presents a line chart illustrating the relationship between "Surprisal" (y-axis) and "Training steps" (x-axis). Two data series are plotted: one representing "Match" and the other "Mismatch" conditions. The chart appears to track the change in surprisal during a training process.
### Components/Axes
* **X-axis:** "Training steps", ranging from approximately 0 to 20000. The axis is linearly scaled.
* **Y-axis:** "Surprisal", ranging from approximately 5.0 to 12.5. The axis is linearly scaled.
* **Legend:** Located in the top-right corner of the chart.
* "Match" - represented by a blue line.
* "Mismatch" - represented by an orange line.
### Detailed Analysis
* **Match (Blue Line):** The line starts at approximately 7.2 at 0 training steps. It initially decreases rapidly to a minimum of approximately 6.8 at around 5000 training steps. After this point, the line plateaus and fluctuates around a value of approximately 7.0 until 20000 training steps.
* **Mismatch (Orange Line):** The line begins at approximately 12.3 at 0 training steps. It decreases sharply initially, reaching a value of approximately 8.0 at around 2000 training steps. The rate of decrease slows down, and the line continues to descend, reaching approximately 7.4 at 20000 training steps.
### Key Observations
* Both "Match" and "Mismatch" lines exhibit a decreasing trend in surprisal as training steps increase, indicating a learning or adaptation process.
* The "Mismatch" condition consistently has a higher surprisal value than the "Match" condition throughout the entire training process.
* The rate of decrease in surprisal is more pronounced in the initial stages of training for both conditions.
* The "Match" line appears to converge towards a stable value around 7.0, while the "Mismatch" line continues to decrease, albeit at a slower rate, until 20000 training steps.
### Interpretation
The chart suggests that the training process reduces the surprisal associated with both "Match" and "Mismatch" conditions. The higher initial and sustained surprisal in the "Mismatch" condition indicates that the model finds it more difficult to predict or accommodate mismatched data. The convergence of the "Match" line suggests that the model learns to effectively handle matching data, while the continued decrease in the "Mismatch" line implies that the model is still adapting to handle mismatched data, but is not fully converging. This could indicate that the mismatch condition represents a more complex or challenging learning scenario. The data suggests a potential difference in the model's ability to generalize to mismatched data compared to matched data. The chart provides insight into the learning dynamics of the model and the impact of data matching on its performance.