## Bar Chart: Top-1 Accuracy vs. Representation Size
### Overview
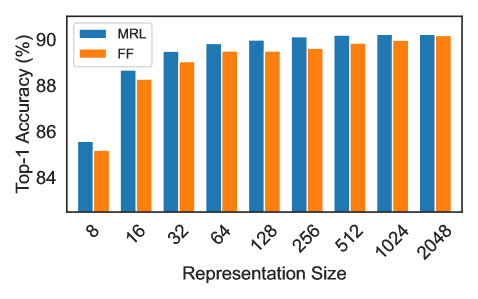
The image is a bar chart comparing the Top-1 Accuracy (%) of two methods, MRL (blue bars) and FF (orange bars), across different Representation Sizes (8, 16, 32, 64, 128, 256, 512, 1024, 2048). The chart illustrates how accuracy changes with increasing representation size for each method.
### Components/Axes
* **Y-axis (Vertical):** "Top-1 Accuracy (%)", ranging from 84% to 90%.
* **X-axis (Horizontal):** "Representation Size", with values 8, 16, 32, 64, 128, 256, 512, 1024, and 2048.
* **Legend:** Located in the top-left corner, indicating:
* Blue bars: "MRL"
* Orange bars: "FF"
### Detailed Analysis
* **MRL (Blue Bars):**
* At Representation Size 8, the accuracy is approximately 85.5%.
* At Representation Size 16, the accuracy is approximately 88.2%.
* At Representation Size 32, the accuracy is approximately 89.1%.
* At Representation Size 64, the accuracy is approximately 89.9%.
* At Representation Size 128, the accuracy is approximately 90.0%.
* At Representation Size 256, the accuracy is approximately 90.1%.
* At Representation Size 512, the accuracy is approximately 90.3%.
* At Representation Size 1024, the accuracy is approximately 90.0%.
* At Representation Size 2048, the accuracy is approximately 90.1%.
* The MRL accuracy increases sharply from 8 to 64, then plateaus around 90%.
* **FF (Orange Bars):**
* At Representation Size 8, the accuracy is approximately 85.2%.
* At Representation Size 16, the accuracy is approximately 88.0%.
* At Representation Size 32, the accuracy is approximately 88.8%.
* At Representation Size 64, the accuracy is approximately 89.3%.
* At Representation Size 128, the accuracy is approximately 89.1%.
* At Representation Size 256, the accuracy is approximately 89.3%.
* At Representation Size 512, the accuracy is approximately 89.2%.
* At Representation Size 1024, the accuracy is approximately 89.9%.
* At Representation Size 2048, the accuracy is approximately 90.1%.
* The FF accuracy increases sharply from 8 to 64, then plateaus around 89-90%.
### Key Observations
* Both MRL and FF methods show a significant increase in Top-1 Accuracy as the Representation Size increases from 8 to 64.
* Beyond a Representation Size of 64, the accuracy for both methods plateaus, with only marginal improvements.
* MRL generally has a slightly higher Top-1 Accuracy than FF, especially at smaller representation sizes.
* At larger representation sizes (1024 and 2048), the performance of MRL and FF is very similar.
### Interpretation
The data suggests that increasing the Representation Size significantly improves the Top-1 Accuracy for both MRL and FF methods, up to a certain point. After a Representation Size of 64, the gains in accuracy become minimal, indicating a point of diminishing returns. The MRL method appears to be slightly more effective than FF, particularly at smaller representation sizes, but their performance converges as the representation size increases. This information is valuable for optimizing model design, as it suggests that there is an optimal representation size beyond which further increases do not significantly improve accuracy and may only increase computational cost.