## Grouped Bar Chart: Top-1 Accuracy vs. Representation Size
### Overview
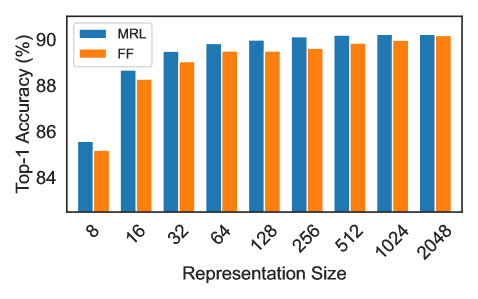
The image displays a grouped bar chart comparing the Top-1 Accuracy (%) of two methods, labeled "MRL" and "FF," across nine different representation sizes. The chart demonstrates how the accuracy of each method changes as the representation size increases from 8 to 2048.
### Components/Axes
* **Chart Type:** Grouped Bar Chart.
* **X-Axis:** Labeled "Representation Size". It has nine categorical tick marks with the following labels, from left to right: `8`, `16`, `32`, `64`, `128`, `256`, `512`, `1024`, `2048`.
* **Y-Axis:** Labeled "Top-1 Accuracy (%)". The scale is linear, with major grid lines and labels at `84`, `86`, `88`, and `90`.
* **Legend:** Located in the top-left corner of the plot area. It contains two entries:
* A blue rectangle labeled "MRL".
* An orange rectangle labeled "FF".
* **Data Series:** Two series of bars, grouped by representation size.
* **MRL Series:** Represented by blue bars.
* **FF Series:** Represented by orange bars.
### Detailed Analysis
The following table reconstructs the approximate data points from the chart. Values are estimated based on the bar heights relative to the y-axis grid lines. Uncertainty is noted where the bar top falls between grid lines.
| Representation Size | MRL (Blue) Accuracy (%) | FF (Orange) Accuracy (%) |
| :------------------ | :---------------------- | :----------------------- |
| 8 | ~85.5 (±0.2) | ~85.0 (±0.2) |
| 16 | ~88.5 (±0.2) | ~88.2 (±0.2) |
| 32 | ~89.5 (±0.2) | ~89.0 (±0.2) |
| 64 | ~89.8 (±0.1) | ~89.5 (±0.1) |
| 128 | ~89.9 (±0.1) | ~89.5 (±0.1) |
| 256 | ~90.0 (±0.1) | ~89.6 (±0.1) |
| 512 | ~90.1 (±0.1) | ~89.8 (±0.1) |
| 1024 | ~90.2 (±0.1) | ~90.0 (±0.1) |
| 2048 | ~90.2 (±0.1) | ~90.1 (±0.1) |
**Trend Verification:**
* **MRL (Blue) Trend:** The blue bars show a clear upward trend from size 8 to 64, after which the increase becomes very gradual, plateauing near 90% from size 256 onward.
* **FF (Orange) Trend:** The orange bars follow a similar upward trajectory, starting lower than MRL at each point but also showing diminishing returns, approaching 90% at the largest sizes.
### Key Observations
1. **Consistent Performance Gap:** The MRL method (blue) achieves a higher Top-1 Accuracy than the FF method (orange) at every representation size shown.
2. **Diminishing Returns:** Both methods exhibit a pattern of diminishing returns. The largest accuracy gains occur when increasing representation size from 8 to 32. Beyond size 64, further increases yield only marginal improvements in accuracy.
3. **Convergence at Large Sizes:** The performance gap between MRL and FF narrows as the representation size increases. At the smallest size (8), the gap is approximately 0.5 percentage points. At the largest size (2048), the gap is very small, approximately 0.1 percentage points.
4. **Plateau Region:** Both methods appear to reach a performance plateau. The accuracy for MRL stabilizes around 90.0-90.2% for sizes 256 and above. The accuracy for FF stabilizes around 89.6-90.1% for sizes 256 and above.
### Interpretation
This chart likely comes from a machine learning or computer vision context, comparing two techniques (MRL and FF) for creating feature representations. The "Representation Size" probably refers to the dimensionality of a feature vector.
The data suggests that **MRL is a more effective method than FF for generating high-accuracy representations**, particularly when computational or memory constraints limit the representation size to smaller values (e.g., 8, 16, 32). The consistent lead of MRL indicates it extracts more discriminative information per dimension.
The trend of diminishing returns is a classic observation in model scaling: beyond a certain point, adding more parameters (or in this case, representation dimensions) provides less benefit. The convergence of the two methods at large sizes implies that with sufficient capacity, the architectural or methodological differences between MRL and FF become less critical, as both can capture nearly all useful information for the task. The primary advantage of MRL, therefore, lies in its **efficiency**—achieving near-peak performance with significantly smaller representation sizes.