# Technical Document Analysis of Line Graph
## Axis Labels and Scale
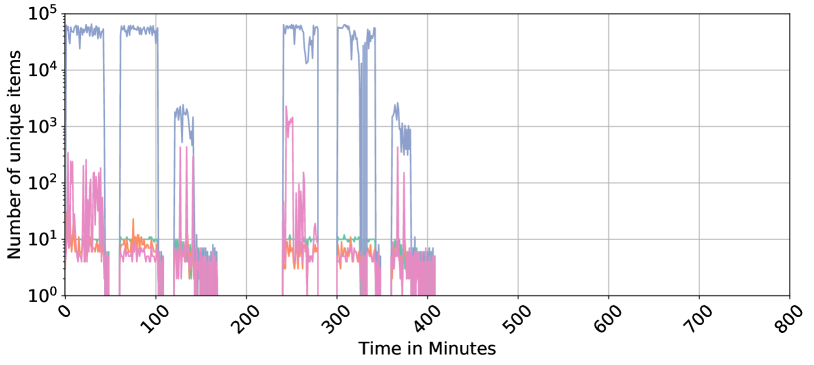
- **Y-Axis**: "Number of unique items" (logarithmic scale: 10⁰ to 10⁵)
- **X-Axis**: "Time in Minutes" (linear scale: 0 to 800)
## Legend
- **Location**: Right side of the graph
- **Color-Series Mapping**:
- **Blue**: Highest magnitude data series
- **Pink**: Moderate magnitude data series
- **Orange**: Low-magnitude data series
- **Green**: Very low-magnitude data series
- **Purple**: Lowest-magnitude data series
## Data Trends
### Blue Line (Highest Magnitude)
- **Trend**: Dominant peaks at 10⁴–10⁵ range
- **Key Intervals**:
- 0–100 minutes: Sustained high activity
- 250–350 minutes: Secondary peak cluster
- **Post-400 Minutes**: Activity collapses to near-zero
### Pink Line (Moderate Magnitude)
- **Trend**: Peaks at 10²–10³ range
- **Key Intervals**:
- 0–100 minutes: Initial activity
- 300–400 minutes: Secondary activity
- **Post-400 Minutes**: Gradual decline to baseline
### Orange Line (Low Magnitude)
- **Trend**: Peaks at 10¹–10² range
- **Key Intervals**:
- 0–100 minutes: Initial activity
- 300–400 minutes: Secondary activity
- **Post-400 Minutes**: Sharp drop to baseline
### Green Line (Very Low Magnitude)
- **Trend**: Peaks at 10⁰–10¹ range
- **Key Intervals**:
- 0–100 minutes: Initial activity
- 300–400 minutes: Secondary activity
- **Post-400 Minutes**: Near-zero values
### Purple Line (Lowest Magnitude)
- **Trend**: Peaks at 10⁰ range
- **Key Intervals**:
- 0–100 minutes: Initial activity
- 300–400 minutes: Secondary activity
- **Post-400 Minutes**: Collapses to baseline
## Spatial Grounding
- **Legend Position**: Right-aligned, adjacent to the graph
- **Color Consistency Check**:
- Blue = Highest peaks (confirmed)
- Pink = Moderate peaks (confirmed)
- Orange/Green/Purple = Lower magnitudes (confirmed)
## Summary
The graph depicts five distinct data series with logarithmic magnitude differences. All series exhibit cyclical activity patterns between 0–400 minutes, with activity decaying to near-zero after 400 minutes. The blue series dominates in magnitude, while purple represents the smallest values. No textual annotations or embedded data tables are present.