## Box Plot: Final Score Stability: AEMA vs single LLM-as-a-Judge (30 runs)
### Overview
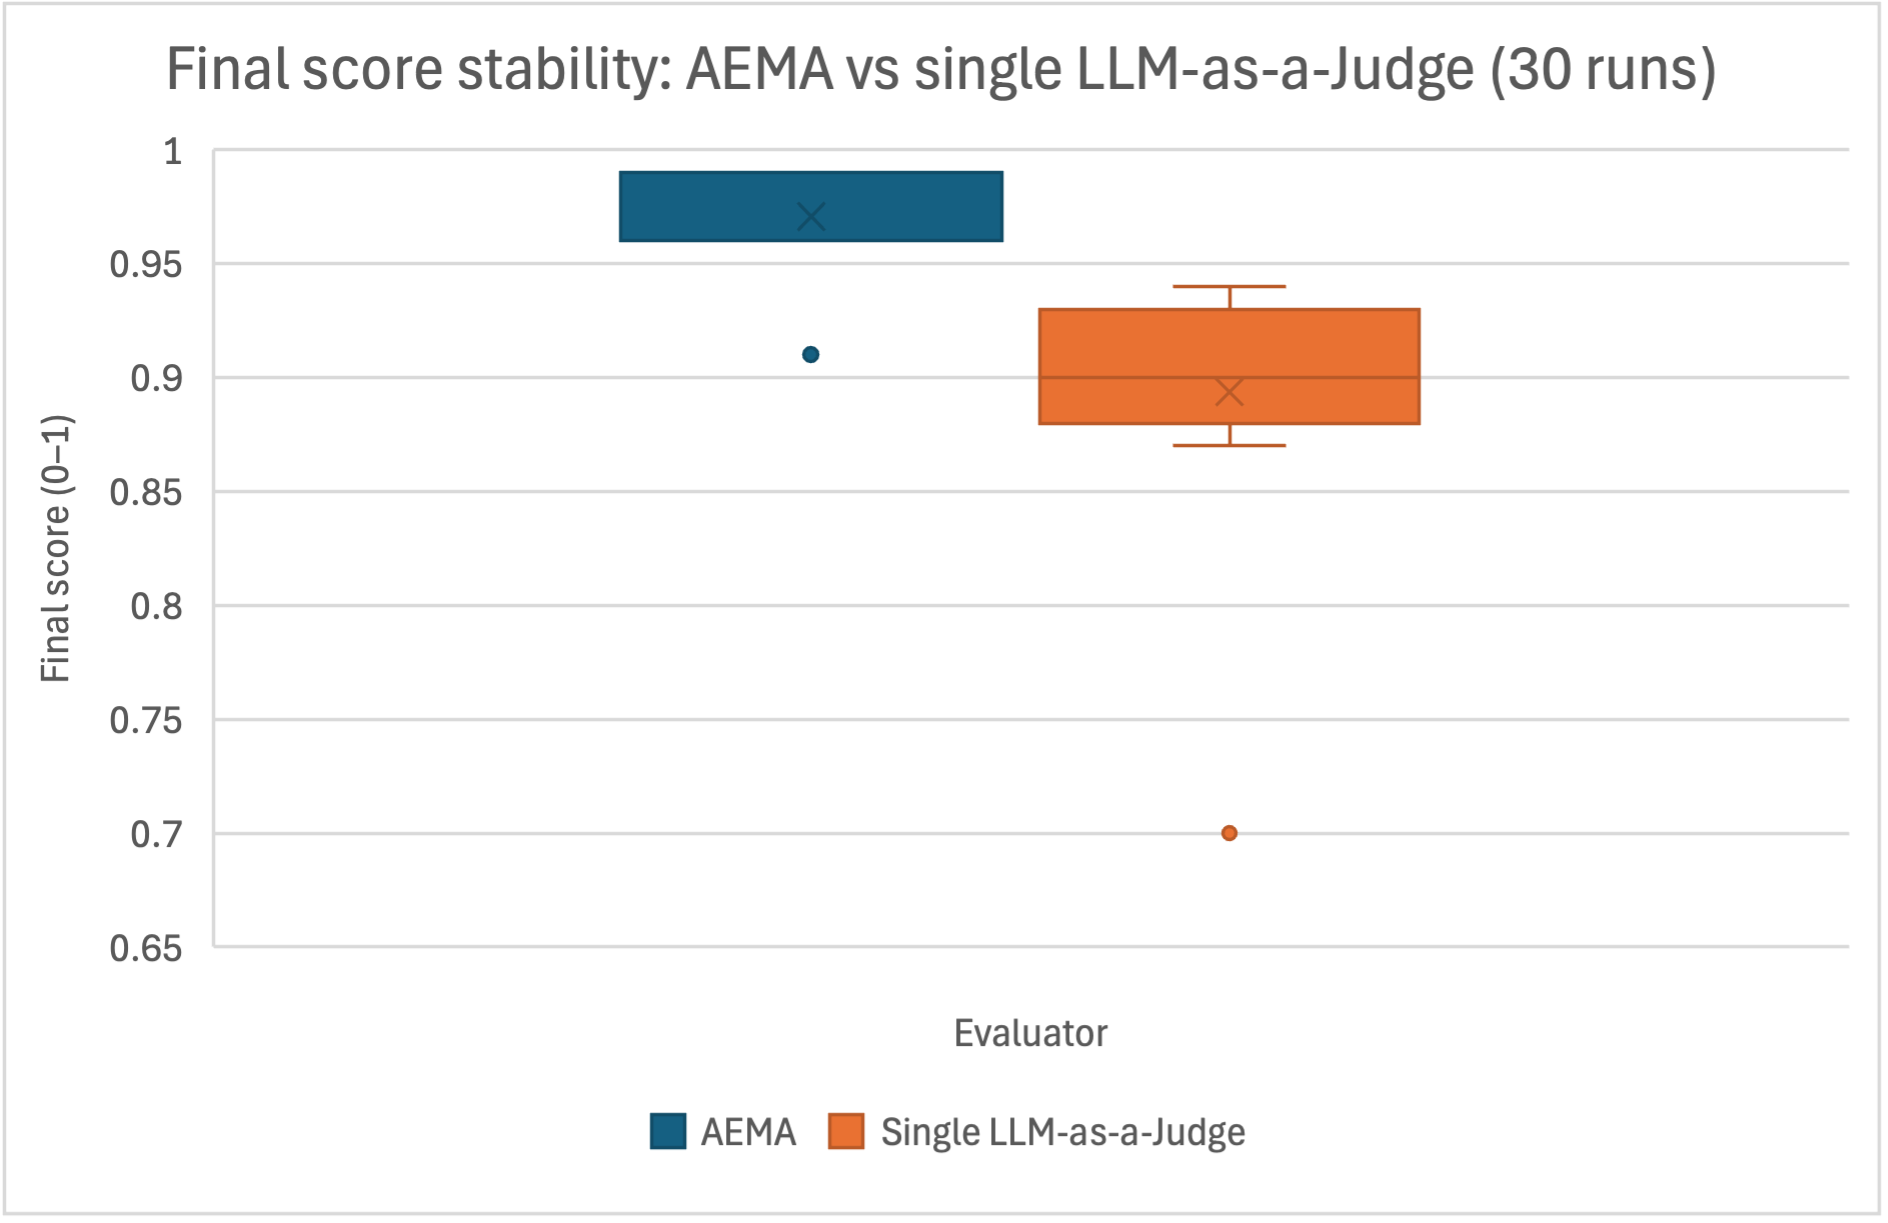
The image is a box plot comparing the final score stability of two evaluators: AEMA (represented in blue) and a single LLM-as-a-Judge (represented in orange). The plot shows the distribution of final scores (ranging from 0 to 1) for each evaluator across 30 runs. The plot includes outliers represented as dots.
### Components/Axes
* **Title:** Final score stability: AEMA vs single LLM-as-a-Judge (30 runs)
* **X-axis:** Evaluator
* **Y-axis:** Final score (0-1). The y-axis ranges from 0.65 to 1, with tick marks at 0.65, 0.7, 0.75, 0.8, 0.85, 0.9, 0.95, and 1.
* **Legend:** Located at the bottom of the chart.
* Blue square: AEMA
* Orange square: Single LLM-as-a-Judge
### Detailed Analysis or Content Details
* **AEMA (Blue):**
* Box: The box extends from approximately 0.96 to 0.99.
* Median (represented by 'x' inside the box): Approximately 0.975.
* Outlier: A single outlier is present at approximately 0.91.
* **Single LLM-as-a-Judge (Orange):**
* Box: The box extends from approximately 0.88 to 0.93.
* Whiskers: The whiskers extend to approximately 0.87 and 0.94.
* Median (represented by 'x' inside the box): Approximately 0.89.
* Outlier: A single outlier is present at approximately 0.70.
### Key Observations
* The AEMA evaluator has a higher median final score and a tighter distribution (smaller box) compared to the single LLM-as-a-Judge.
* Both evaluators have one outlier each, with the single LLM-as-a-Judge outlier being significantly lower than the AEMA outlier.
* The AEMA scores are generally more stable and higher than the Single LLM-as-a-Judge scores.
### Interpretation
The box plot suggests that the AEMA evaluator demonstrates greater stability and achieves higher final scores compared to the single LLM-as-a-Judge, based on 30 runs. The smaller box for AEMA indicates less variability in its scores. The presence of outliers for both evaluators suggests occasional instances of significantly lower performance, but the single LLM-as-a-Judge has a more extreme low score. This could indicate that the AEMA method is more robust and consistent in its evaluations.