\n
## Box Plot: Final Score Stability - AEMA vs Single LLM-as-a-Judge (30 Runs)
### Overview
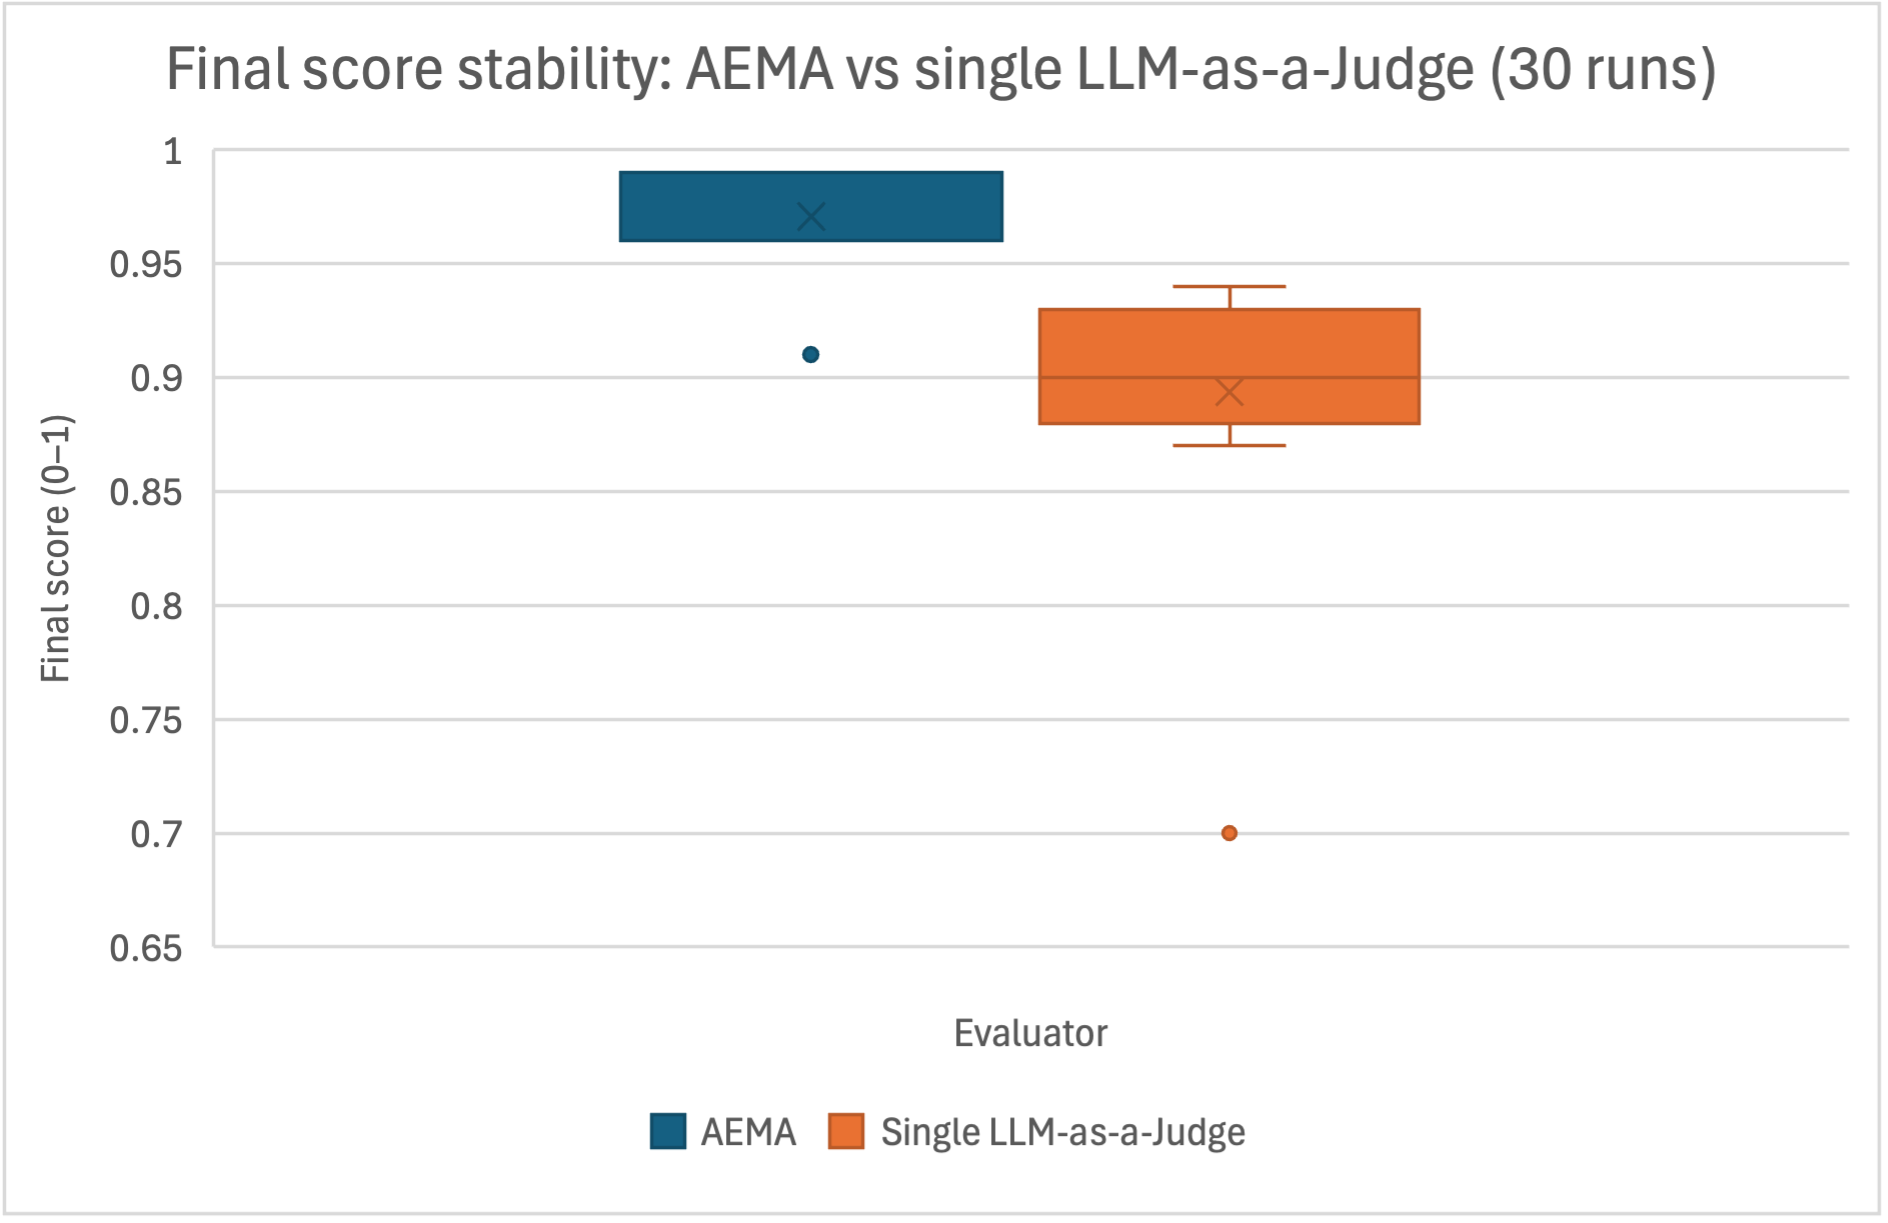
The image presents a box plot comparing the final score stability of AEMA (Automated Evaluation Metric Aggregation) and a single LLM-as-a-Judge across 30 runs. The y-axis represents the final score, scaled from 0 to 1, while the x-axis indicates the evaluator type.
### Components/Axes
* **Title:** "Final score stability: AEMA vs single LLM-as-a-Judge (30 runs)" - positioned at the top-center.
* **X-axis Label:** "Evaluator" - positioned at the bottom-center.
* **Y-axis Label:** "Final score (0-1)" - positioned vertically along the left side.
* **Legend:** Located at the bottom-center, with two entries:
* Blue box: "AEMA"
* Orange box: "Single LLM-as-a-Judge"
* **Data Series:** Two box plots representing the distribution of final scores for each evaluator.
* **Outliers:** Individual data points plotted as circles outside the box plots.
### Detailed Analysis
The box plots display the following characteristics:
**AEMA (Blue Box):**
* The box plot is positioned on the left side of the chart.
* The box extends from approximately 0.92 to 0.97.
* The median (represented by the 'X' inside the box) is around 0.96.
* The interquartile range (IQR) is approximately 0.05.
* There is one outlier at approximately 0.91.
**Single LLM-as-a-Judge (Orange Box):**
* The box plot is positioned on the right side of the chart.
* The box extends from approximately 0.88 to 0.94.
* The median (represented by the 'X' inside the box) is around 0.90.
* The IQR is approximately 0.06.
* There is one outlier at approximately 0.71.
### Key Observations
* AEMA demonstrates a slightly higher median final score (0.96) compared to the Single LLM-as-a-Judge (0.90).
* The AEMA scores appear to be more tightly clustered, as indicated by the smaller IQR (0.05) compared to the LLM-as-a-Judge (0.06).
* The LLM-as-a-Judge has a lower outlier (0.71) than AEMA (0.91), suggesting greater variability in its scores.
### Interpretation
The data suggests that AEMA provides more stable and consistently high final scores compared to using a single LLM-as-a-Judge. The narrower IQR for AEMA indicates less score variation, implying a more reliable evaluation process. The presence of an outlier at 0.71 for the LLM-as-a-Judge suggests that, in some instances, its evaluation can deviate significantly from the typical range. This could be due to the inherent variability in LLM responses or sensitivity to specific input characteristics. The higher median score for AEMA suggests it may be better calibrated to provide accurate and consistent evaluations. The difference in stability could be attributed to AEMA's aggregation of multiple metrics, which mitigates the impact of individual metric fluctuations.