## Line Chart: Accuracy vs. #Sampled Reasoning Paths
### Overview
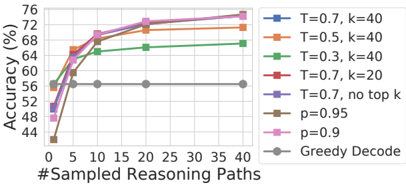
This chart illustrates the impact of different decoding strategies on model accuracy as the number of sampled reasoning paths increases. The x-axis represents the number of reasoning paths sampled (1, 5, 10, 20, 40), and the y-axis represents the accuracy percentage (ranging from 44% to 76%). The chart demonstrates that for most strategies, increasing the number of sampled paths leads to higher accuracy, following a curve of diminishing returns.
### Components/Axes
* **X-Axis:** "#Sampled Reasoning Paths". Scale: 0, 5, 10, 15, 20, 25, 30, 35, 40.
* **Y-Axis:** "Accuracy (%)". Scale: 44, 48, 52, 56, 60, 64, 68, 72, 76.
* **Legend:** Positioned in the top-right quadrant. It lists eight distinct decoding strategies, each represented by a specific color and marker shape (squares for sampling methods, circles for Greedy Decode).
**Legend Key:**
* **Blue Square:** T=0.7, k=40
* **Orange Square:** T=0.5, k=40
* **Green Square:** T=0.3, k=40
* **Red Square:** T=0.7, k=20
* **Purple Square:** T=0.7, no top k
* **Brown Square:** p=0.95
* **Pink Square:** p=0.9
* **Grey Circle:** Greedy Decode
### Detailed Analysis
The chart displays a general upward trend for all strategies except "Greedy Decode." The most significant gains occur between 1 and 10 sampled paths, after which the curves begin to flatten.
**Data Series Trends:**
1. **Greedy Decode (Grey Circle):**
* **Trend:** Horizontal line.
* **Values:** Remains constant at approximately 57% accuracy across all path counts (1, 5, 10, 20, 40).
2. **T=0.7, k=40 (Blue Square):**
* **Trend:** Steep upward slope from 1 to 10, then gradual increase.
* **Values:** Starts at ~51%, rises to ~64% (x=5), ~68% (x=10), ~72% (x=20), and ends at ~75% (x=40).
3. **T=0.5, k=40 (Orange Square):**
* **Trend:** Sharp initial rise, then flattens significantly.
* **Values:** Starts at ~55%, rises to ~65% (x=5), ~68% (x=10), ~70% (x=20), and ends at ~71% (x=40).
4. **T=0.3, k=40 (Green Square):**
* **Trend:** Moderate upward slope, flattens early.
* **Values:** Starts at ~57%, rises to ~64% (x=5), ~65% (x=10), ~66% (x=20), and ends at ~67% (x=40).
5. **T=0.7, k=20 (Red Square):**
* **Trend:** Strong upward slope.
* **Values:** Starts at ~50%, rises to ~63% (x=5), ~68% (x=10), ~72% (x=20), and ends at ~74% (x=40).
6. **T=0.7, no top k (Purple Square):**
* **Trend:** Strong upward slope, tracks closely with Blue and Pink.
* **Values:** Starts at ~51%, rises to ~63% (x=5), ~69% (x=10), ~72% (x=20), and ends at ~75% (x=40).
7. **p=0.95 (Brown Square):**
* **Trend:** Starts lowest, but shows the steepest initial recovery.
* **Values:** Starts at ~42%, rises to ~59% (x=5), ~68% (x=10), ~71% (x=20), and ends at ~71% (x=40).
8. **p=0.9 (Pink Square):**
* **Trend:** Strong upward slope, ends as one of the highest performers.
* **Values:** Starts at ~48%, rises to ~63% (x=5), ~69% (x=10), ~73% (x=20), and ends at ~75% (x=40).
### Key Observations
* **Diminishing Returns:** Almost all sampling methods show the most dramatic accuracy gains when moving from 1 to 10 paths. Increasing from 20 to 40 paths yields marginal improvements.
* **Greedy Baseline:** The "Greedy Decode" method is invariant to the number of sampled paths, serving as a static baseline.
* **Performance Ceiling:** At 40 sampled paths, the top-performing strategies (T=0.7, no top k; p=0.9; T=0.7, k=40) converge around 75% accuracy.
* **Low-Temperature Limitation:** The "T=0.3, k=40" (Green) strategy starts with a relatively high baseline (57%) but fails to scale as effectively as higher-temperature strategies, ending as the lowest-performing sampling method at 40 paths.
### Interpretation
This chart demonstrates the effectiveness of **Self-Consistency** or **Chain-of-Thought sampling** in Large Language Models. By sampling multiple reasoning paths and aggregating the results, the model can overcome the limitations of a single, deterministic "Greedy" output.
The data suggests that higher temperature settings (T=0.7) or broader sampling (p=0.9, no top k) are generally superior for this task when using multiple paths, as they likely encourage more diverse reasoning trajectories that can be filtered or voted upon. Conversely, lower temperature (T=0.3) likely restricts the diversity of the reasoning paths too much, limiting the potential gains from sampling. The "p=0.95" strategy's trajectory suggests that while it may be less stable at very low path counts, it is highly effective once a sufficient number of samples are collected.