## Line Graph: Accuracy vs. #Sampled Reasoning Paths
### Overview
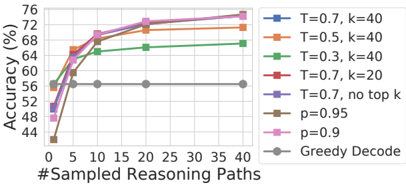
The graph compares the accuracy of different sampling strategies for a reasoning task, plotting accuracy (%) against the number of sampled reasoning paths (0–40). Multiple lines represent variations in temperature (T), top-k sampling (k), probability thresholds (p), and greedy decoding. All lines show upward trends, with accuracy increasing as more paths are sampled.
### Components/Axes
- **Y-axis**: Accuracy (%) ranging from 44% to 76%.
- **X-axis**: #Sampled Reasoning Paths (0–40).
- **Legend**: Located on the right, with 8 entries:
- Blue: T=0.7, k=40
- Orange: T=0.5, k=40
- Green: T=0.3, k=40
- Red: T=0.7, k=20
- Purple: T=0.7, no top k
- Brown: p=0.95
- Pink: p=0.9
- Gray: Greedy Decode
### Detailed Analysis
1. **Blue Line (T=0.7, k=40)**: Starts at ~52% (0 paths) and rises to ~72% (40 paths). Steepest slope.
2. **Orange Line (T=0.5, k=40)**: Begins at ~54%, reaches ~70% at 40 paths. Slightly less steep than blue.
3. **Green Line (T=0.3, k=40)**: Flattest curve, starting at ~56% and plateauing at ~66%.
4. **Red Line (T=0.7, k=20)**: Starts at ~54%, ends at ~68%. Less effective than k=40.
5. **Purple Line (T=0.7, no top k)**: Begins at ~50%, reaches ~66%. Similar to red line but lower initial accuracy.
6. **Brown Line (p=0.95)**: Starts at ~48%, ends at ~64%. Lower than all T-based strategies.
7. **Pink Line (p=0.9)**: Starts at ~46%, ends at ~62%. Worst-performing strategy.
8. **Gray Line (Greedy Decode)**: Flat line at ~56%, indicating no improvement with sampling.
### Key Observations
- **Temperature and Top-k Impact**: Higher T (0.7) and larger k (40) yield the highest accuracy. Reducing T to 0.3 or k to 20 significantly lowers performance.
- **Probability Thresholds**: Lower p (0.9) results in the poorest accuracy, suggesting stricter thresholds degrade performance.
- **Greedy Decoding**: Performs consistently worse than all sampling methods, highlighting the value of sampling.
### Interpretation
The data demonstrates that **sampling strategies with higher temperature (T) and larger top-k values** (e.g., T=0.7, k=40) maximize accuracy, likely by exploring more diverse reasoning paths. Conversely, **probability-based methods** (p=0.9, 0.95) underperform, possibly due to overly restrictive sampling. **Greedy decoding** (no sampling) is the least effective, underscoring the importance of stochastic exploration. The trade-off between computational cost (more paths) and accuracy is evident, with diminishing returns observed as paths increase beyond ~20–25. This suggests optimizing sampling parameters for balance between efficiency and performance.