\n
## Bar Chart: Prediction Flip Rate for Llama Models
### Overview
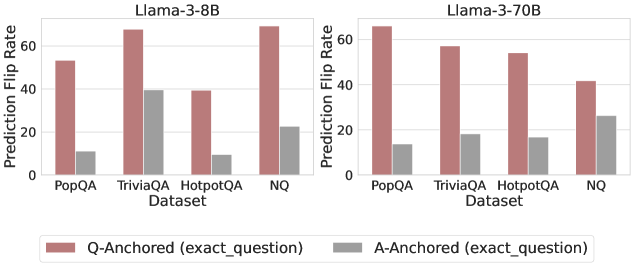
This image presents a comparative bar chart illustrating the Prediction Flip Rate for two Llama models – Llama-3-8B and Llama-3-70B – across four different datasets: PopQA, TriviaQA, HotpotQA, and NQ. The chart compares the flip rates for questions anchored to the original question ("Q-Anchored") versus those anchored to the answer ("A-Anchored").
### Components/Axes
* **X-axis:** Dataset (PopQA, TriviaQA, HotpotQA, NQ)
* **Y-axis:** Prediction Flip Rate (ranging from 0 to 60, with increments of 10)
* **Models:** Two separate charts are presented side-by-side, one for Llama-3-8B and one for Llama-3-70B.
* **Legend:** Located at the bottom-center of the image.
* **Q-Anchored (exact_question):** Represented by a reddish-brown color.
* **A-Anchored (exact_question):** Represented by a gray color.
### Detailed Analysis
**Llama-3-8B Chart (Left)**
* **PopQA:** The Q-Anchored bar has a height of approximately 52. The A-Anchored bar has a height of approximately 8.
* **TriviaQA:** The Q-Anchored bar has a height of approximately 58. The A-Anchored bar has a height of approximately 42.
* **HotpotQA:** The Q-Anchored bar has a height of approximately 42. The A-Anchored bar has a height of approximately 10.
* **NQ:** The Q-Anchored bar has a height of approximately 56. The A-Anchored bar has a height of approximately 24.
**Llama-3-70B Chart (Right)**
* **PopQA:** The Q-Anchored bar has a height of approximately 60. The A-Anchored bar has a height of approximately 6.
* **TriviaQA:** The Q-Anchored bar has a height of approximately 54. The A-Anchored bar has a height of approximately 36.
* **HotpotQA:** The Q-Anchored bar has a height of approximately 52. The A-Anchored bar has a height of approximately 12.
* **NQ:** The Q-Anchored bar has a height of approximately 46. The A-Anchored bar has a height of approximately 26.
In both charts, the Q-Anchored bars are consistently higher than the A-Anchored bars across all datasets. The Q-Anchored bars generally exhibit a similar height across the datasets, while the A-Anchored bars show more variation.
### Key Observations
* The Prediction Flip Rate is significantly higher for Q-Anchored prompts compared to A-Anchored prompts for both models.
* The Llama-3-70B model generally exhibits a higher Prediction Flip Rate for Q-Anchored prompts than the Llama-3-8B model.
* The A-Anchored flip rates are relatively low and consistent across datasets for both models.
* TriviaQA shows the largest difference between Q-Anchored and A-Anchored flip rates for both models.
### Interpretation
The data suggests that anchoring predictions to the original question ("Q-Anchored") leads to a substantially higher rate of prediction flips compared to anchoring them to the answer ("A-Anchored"). This implies that the models are more sensitive to changes in the question phrasing than changes in the answer. The larger difference observed in the TriviaQA dataset might indicate that this dataset presents more challenging or ambiguous questions, making the models more susceptible to flipping predictions based on slight variations in the question.
The higher flip rates for the Llama-3-70B model could be attributed to its larger size and increased capacity to capture nuanced relationships within the data. However, it also suggests that the larger model might be more prone to overfitting or sensitivity to specific input patterns.
The consistently low A-Anchored flip rates suggest that the models are relatively stable when the context is anchored to the answer, indicating that the answer itself provides a stronger and more reliable basis for prediction. This could be due to the answer being a more definitive and less ambiguous piece of information compared to the question.