# Technical Data Extraction: Performance Comparison Across Evaluation Metrics
This document provides a comprehensive extraction of data from a series of four bar charts comparing different methodologies across various evaluation metrics.
## 1. Document Overview
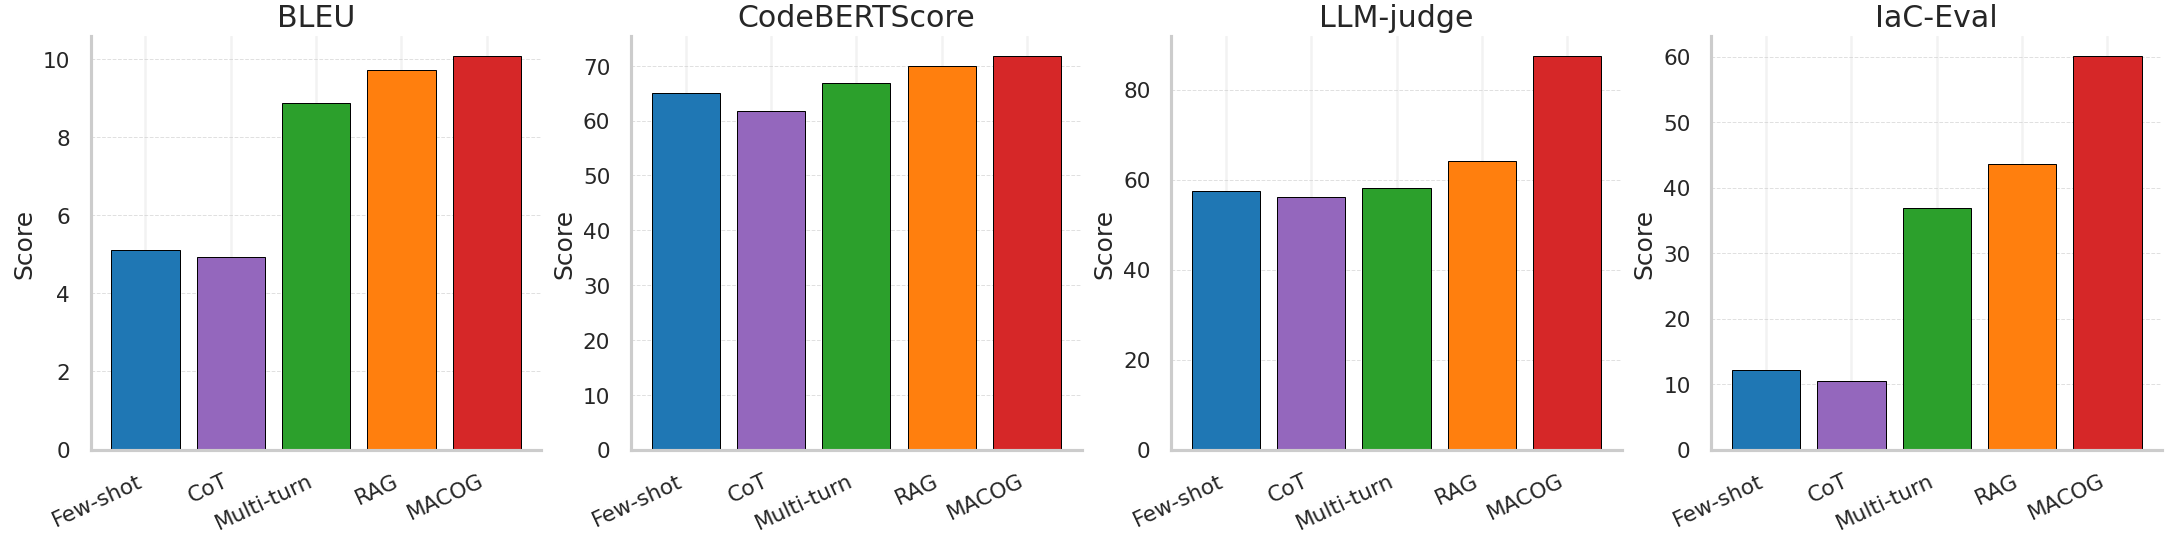
The image consists of four side-by-side bar charts. Each chart represents a different evaluation metric (BLEU, CodeBERTScore, LLM-judge, and IaC-Eval) and measures the performance "Score" of five distinct methodologies.
### Global Components
* **X-Axis (Common to all charts):** Methodologies
* **Few-shot** (Blue bar)
* **CoT** (Purple bar)
* **Multi-turn** (Green bar)
* **RAG** (Orange bar)
* **MACOG** (Red bar)
* **Y-Axis:** Labeled as "Score" with varying scales per metric.
* **Visual Trend:** Across all four metrics, there is a general upward trend from left to right, with **MACOG** consistently achieving the highest score and **CoT** or **Few-shot** typically achieving the lowest.
---
## 2. Detailed Data Extraction by Metric
### Chart 1: BLEU
* **Metric:** BLEU
* **Y-Axis Scale:** 0 to 10 (increments of 2)
* **Trend Analysis:** Performance is relatively flat between Few-shot and CoT, followed by a significant step up for Multi-turn, RAG, and MACOG.
* **Data Points (Approximate):**
* Few-shot: ~5.1
* CoT: ~4.9
* Multi-turn: ~8.9
* RAG: ~9.7
* MACOG: ~10.1
### Chart 2: CodeBERTScore
* **Metric:** CodeBERTScore
* **Y-Axis Scale:** 0 to 70+ (increments of 10)
* **Trend Analysis:** A slight dip occurs from Few-shot to CoT, followed by a steady linear increase through Multi-turn, RAG, and MACOG.
* **Data Points (Approximate):**
* Few-shot: ~65
* CoT: ~62
* Multi-turn: ~67
* RAG: ~70
* MACOG: ~72
### Chart 3: LLM-judge
* **Metric:** LLM-judge
* **Y-Axis Scale:** 0 to 80+ (increments of 20)
* **Trend Analysis:** Performance is stable across the first three methods (~60 range), with a moderate increase for RAG and a very sharp increase for MACOG, which outperforms all others significantly.
* **Data Points (Approximate):**
* Few-shot: ~58
* CoT: ~57
* Multi-turn: ~59
* RAG: ~65
* MACOG: ~88
### Chart 4: IaC-Eval
* **Metric:** IaC-Eval
* **Y-Axis Scale:** 0 to 60 (increments of 10)
* **Trend Analysis:** This metric shows the most dramatic variance. There is a massive performance leap between CoT and Multi-turn, continuing upward to MACOG.
* **Data Points (Approximate):**
* Few-shot: ~12
* CoT: ~11
* Multi-turn: ~37
* RAG: ~44
* MACOG: ~60
---
## 3. Summary Table of Extracted Values
| Methodology | BLEU | CodeBERTScore | LLM-judge | IaC-Eval |
| :--- | :---: | :---: | :---: | :---: |
| **Few-shot** (Blue) | ~5.1 | ~65 | ~58 | ~12 |
| **CoT** (Purple) | ~4.9 | ~62 | ~57 | ~11 |
| **Multi-turn** (Green) | ~8.9 | ~67 | ~59 | ~37 |
| **RAG** (Orange) | ~9.7 | ~70 | ~65 | ~44 |
| **MACOG** (Red) | ~10.1 | ~72 | ~88 | ~60 |
## 4. Language Declaration
The text in this image is entirely in **English**. No other languages were detected.