## Chart Type: Multiple Charts Comparing Model Accuracy
### Overview
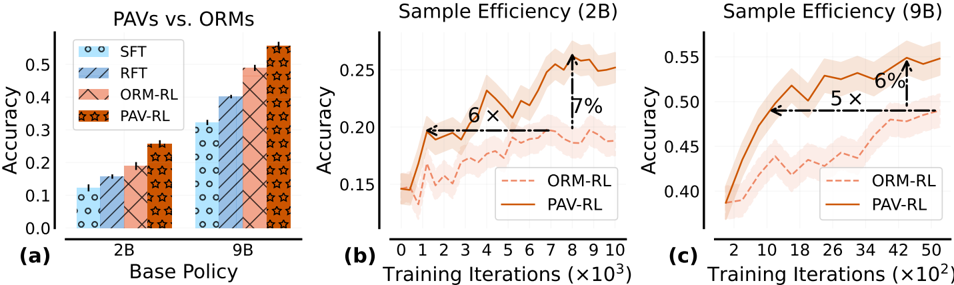
The image presents three charts comparing the accuracy of different models (SFT, RFT, ORM-RL, and PAV-RL) under varying conditions. Chart (a) compares the accuracy of PAV-RL and ORM-RL against SFT and RFT for base policies 2B and 9B. Charts (b) and (c) show the sample efficiency of ORM-RL and PAV-RL for 2B and 9B base policies, respectively, plotting accuracy against training iterations.
### Components/Axes
**Chart (a): PAVs vs. ORMs**
* **Title:** PAVs vs. ORMs
* **X-axis:** Base Policy (2B, 9B)
* **Y-axis:** Accuracy (0.0 to 0.5, incrementing by 0.1)
* **Legend (top-left):**
* SFT (light blue with circles)
* RFT (blue with diagonal lines)
* ORM-RL (light orange with diagonal lines)
* PAV-RL (dark orange with stars)
**Chart (b): Sample Efficiency (2B)**
* **Title:** Sample Efficiency (2B)
* **X-axis:** Training Iterations (x10^3) (0 to 10, incrementing by 1)
* **Y-axis:** Accuracy (0.15 to 0.25, incrementing by 0.05)
* **Legend (bottom):**
* ORM-RL (light orange, dashed line)
* PAV-RL (dark orange, solid line)
**Chart (c): Sample Efficiency (9B)**
* **Title:** Sample Efficiency (9B)
* **X-axis:** Training Iterations (x10^2) (2 to 50, uneven increments)
* **Y-axis:** Accuracy (0.40 to 0.55, incrementing by 0.05)
* **Legend (bottom):**
* ORM-RL (light orange, dashed line)
* PAV-RL (dark orange, solid line)
### Detailed Analysis
**Chart (a): PAVs vs. ORMs**
* **SFT (2B):** Accuracy ~0.12
* **RFT (2B):** Accuracy ~0.16
* **ORM-RL (2B):** Accuracy ~0.19
* **PAV-RL (2B):** Accuracy ~0.26
* **SFT (9B):** Accuracy ~0.32
* **RFT (9B):** Accuracy ~0.40
* **ORM-RL (9B):** Accuracy ~0.48
* **PAV-RL (9B):** Accuracy ~0.53
**Chart (b): Sample Efficiency (2B)**
* **ORM-RL:** Starts at ~0.15, increases to ~0.20 by iteration 2, then fluctuates between 0.18 and 0.20.
* **PAV-RL:** Starts at ~0.15, increases sharply to ~0.24 by iteration 8, then plateaus.
* The annotation "6x" indicates the PAV-RL reaches the same accuracy as ORM-RL 6x faster.
* The annotation "7%" indicates the PAV-RL achieves 7% higher accuracy than ORM-RL.
**Chart (c): Sample Efficiency (9B)**
* **ORM-RL:** Starts at ~0.40, increases to ~0.48 by iteration 18, then fluctuates around 0.48.
* **PAV-RL:** Starts at ~0.42, increases sharply to ~0.50 by iteration 10, then plateaus around 0.53.
* The annotation "5x" indicates the PAV-RL reaches the same accuracy as ORM-RL 5x faster.
* The annotation "6%" indicates the PAV-RL achieves 6% higher accuracy than ORM-RL.
### Key Observations
* PAV-RL consistently outperforms ORM-RL in both base policies (2B and 9B).
* Increasing the base policy from 2B to 9B significantly improves the accuracy of all models.
* PAV-RL demonstrates better sample efficiency, reaching higher accuracy levels faster than ORM-RL.
### Interpretation
The data suggests that PAV-RL is a more effective approach than ORM-RL for improving model accuracy, especially when considering sample efficiency. The increase in accuracy from 2B to 9B base policies highlights the importance of model size. The annotations on charts (b) and (c) quantify the performance advantage of PAV-RL, showing it achieves similar accuracy levels much faster and ultimately reaches higher accuracy. This implies that PAV-RL requires fewer training iterations to achieve better results, making it a more efficient choice.