## Bar Chart and Line Charts: PAVs vs. ORMs and Sample Efficiency
### Overview
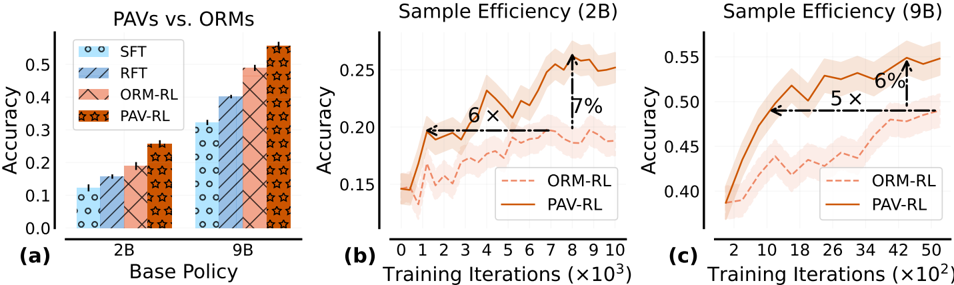
The image contains three distinct subplots arranged horizontally, labeled (a), (b), and (c). It presents a comparative performance analysis of different training methods (SFT, RFT, ORM-RL, PAV-RL) applied to two base policy sizes (2B and 9B parameters). The primary metrics are accuracy and sample efficiency during training.
### Components/Axes
**Subplot (a): Bar Chart**
* **Title:** "PAVs vs. ORMs"
* **X-axis:** "Base Policy" with two categorical groups: "2B" and "9B".
* **Y-axis:** "Accuracy", ranging from 0.0 to approximately 0.55.
* **Legend (Top-Left):** Contains four entries with distinct colors and patterns:
* `SFT`: Light blue with small circles.
* `RFT`: Medium blue with diagonal stripes (top-left to bottom-right).
* `ORM-RL`: Light orange/salmon with diagonal cross-hatching.
* `PAV-RL`: Dark orange/brown with a star pattern.
**Subplot (b): Line Chart**
* **Title:** "Sample Efficiency (2B)"
* **X-axis:** "Training Iterations (×10³)", ranging from 0 to 10.
* **Y-axis:** "Accuracy", ranging from approximately 0.15 to 0.25.
* **Legend (Bottom-Right):**
* `ORM-RL`: Dashed orange line.
* `PAV-RL`: Solid orange line.
* **Annotations:** Two dashed black arrows with text:
* A horizontal arrow pointing left from the PAV-RL line at ~8k iterations, labeled "6×".
* A vertical arrow pointing up from the ORM-RL line to the PAV-RL line at ~8k iterations, labeled "7%".
**Subplot (c): Line Chart**
* **Title:** "Sample Efficiency (9B)"
* **X-axis:** "Training Iterations (×10²)", ranging from 2 to 50.
* **Y-axis:** "Accuracy", ranging from approximately 0.40 to 0.55.
* **Legend (Bottom-Right):** Same as subplot (b).
* **Annotations:** Two dashed black arrows with text:
* A horizontal arrow pointing left from the PAV-RL line at ~42k iterations, labeled "5×".
* A vertical arrow pointing up from the ORM-RL line to the PAV-RL line at ~42k iterations, labeled "6%".
### Detailed Analysis
**Subplot (a) - Accuracy by Method and Policy Size:**
* **2B Policy Group:**
* `SFT`: Accuracy ≈ 0.12.
* `RFT`: Accuracy ≈ 0.18.
* `ORM-RL`: Accuracy ≈ 0.22.
* `PAV-RL`: Accuracy ≈ 0.27.
* **Trend:** Accuracy increases progressively from SFT to PAV-RL.
* **9B Policy Group:**
* `SFT`: Accuracy ≈ 0.32.
* `RFT`: Accuracy ≈ 0.40.
* `ORM-RL`: Accuracy ≈ 0.49.
* `PAV-RL`: Accuracy ≈ 0.54.
* **Trend:** Same increasing trend as the 2B group, with all methods showing higher absolute accuracy than their 2B counterparts.
**Subplot (b) - Training Efficiency for 2B Model:**
* **ORM-RL (Dashed Line):** Starts at ~0.15 accuracy. Shows a noisy but generally upward trend, reaching ~0.20 accuracy by 10k iterations. The shaded confidence interval is relatively wide.
* **PAV-RL (Solid Line):** Starts at a similar point (~0.15). Rises more steeply and consistently, reaching ~0.25 accuracy by 8k iterations before plateauing slightly. Its confidence interval is narrower than ORM-RL's.
* **Key Annotations:** The "6×" arrow suggests PAV-RL achieves a certain performance level (e.g., 0.20 accuracy) about 6 times faster (in terms of iterations) than ORM-RL. The "7%" arrow indicates that at 8k iterations, PAV-RL's accuracy is approximately 7 percentage points higher than ORM-RL's.
**Subplot (c) - Training Efficiency for 9B Model:**
* **ORM-RL (Dashed Line):** Starts at ~0.38 accuracy. Increases gradually with significant noise, reaching ~0.49 accuracy by 50k iterations.
* **PAV-RL (Solid Line):** Starts at ~0.38. Shows a rapid initial increase, surpassing 0.50 accuracy by ~18k iterations and continuing to rise to ~0.55 by 50k iterations.
* **Key Annotations:** The "5×" arrow suggests PAV-RL reaches a target performance level about 5 times faster than ORM-RL. The "6%" arrow indicates a 6 percentage point accuracy advantage for PAV-RL over ORM-RL at the point of comparison (~42k iterations).
### Key Observations
1. **Consistent Superiority of PAV-RL:** Across both model sizes (2B and 9B) and in both final accuracy (chart a) and training efficiency (charts b & c), the PAV-RL method outperforms all others (SFT, RFT, ORM-RL).
2. **Scaling Benefit:** Moving from a 2B to a 9B base policy yields a significant accuracy boost for all methods (e.g., PAV-RL jumps from ~0.27 to ~0.54).
3. **Efficiency Gap:** The sample efficiency charts (b & c) highlight that PAV-RL not only reaches higher final accuracy but does so with significantly fewer training iterations (5-6× faster) compared to ORM-RL.
4. **Reduced Variance:** The confidence intervals (shaded regions) for PAV-RL in the line charts appear narrower than those for ORM-RL, suggesting more stable and consistent training.
### Interpretation
This data strongly suggests that the **PAV-RL** training methodology is more effective and efficient than the compared alternatives (SFT, RFT, ORM-RL) for the tasks evaluated. The "PAVs vs. ORMs" title implies a comparison between two paradigms, with PAVs (likely "Policy-Aware Value" methods) demonstrating a clear advantage over ORMs (likely "Outcome Reward Models").
The **5-6× speedup** in sample efficiency is a critical finding, indicating that PAV-RL requires substantially less computational resources (training iterations) to achieve the same or better performance. This has major implications for reducing training costs and time. The consistent performance gap across different model scales (2B and 9B) suggests the advantage of PAV-RL is robust and not an artifact of a specific model size. The narrowing of confidence intervals for PAV-RL may indicate it is a more stable optimization process. Overall, the charts build a compelling case for the adoption of PAV-RL over the other presented methods.