## Bar Chart and Line Graphs: PAVs vs. ORMs and Sample Efficiency
### Overview
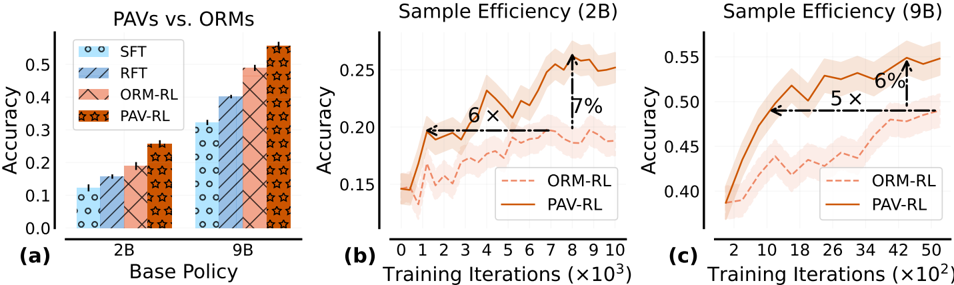
The image contains three subplots comparing the performance of different reinforcement learning (RL) methods: **PAVs** (Proximal Actor-Critic with Value Regularization) and **ORMs** (Oracle Model-based RL). Subplot (a) compares accuracy across base policies (2B and 9B), while subplots (b) and (c) analyze sample efficiency over training iterations for 2B and 9B, respectively. Key metrics include accuracy, training iterations, and relative performance improvements.
---
### Components/Axes
#### Subplot (a): PAVs vs. ORMs
- **X-axis**: "Base Policy" (categories: 2B, 9B).
- **Y-axis**: "Accuracy" (scale: 0.0 to 0.5).
- **Legend**:
- **SFT** (blue circles).
- **RFT** (blue stripes).
- **ORM-RL** (pink stripes).
- **PAV-RL** (orange stars).
- **Bars**: Grouped by base policy (2B and 9B), with patterns/colors matching the legend.
#### Subplot (b): Sample Efficiency (2B)
- **X-axis**: "Training Iterations (×10³)" (0 to 10).
- **Y-axis**: "Accuracy" (0.15 to 0.25).
- **Lines**:
- **ORM-RL** (dashed red).
- **PAV-RL** (solid orange).
- **Annotations**:
- "6×" improvement for PAV-RL.
- "7%" accuracy increase for PAV-RL.
#### Subplot (c): Sample Efficiency (9B)
- **X-axis**: "Training Iterations (×10²)" (2 to 50).
- **Y-axis**: "Accuracy" (0.40 to 0.55).
- **Lines**:
- **ORM-RL** (dashed red).
- **PAV-RL** (solid orange).
- **Annotations**:
- "5×" improvement for PAV-RL.
- "6%" accuracy increase for PAV-RL.
---
### Detailed Analysis
#### Subplot (a): Accuracy Comparison
- **2B Base Policy**:
- SFT: ~0.12.
- RFT: ~0.15.
- ORM-RL: ~0.18.
- PAV-RL: ~0.25.
- **9B Base Policy**:
- SFT: ~0.30.
- RFT: ~0.35.
- ORM-RL: ~0.40.
- PAV-RL: ~0.45.
- **Trend**: PAV-RL consistently outperforms ORM-RL and other methods across both base policies.
#### Subplot (b): Sample Efficiency (2B)
- **Trend**:
- PAV-RL (solid orange) starts higher and maintains a lead over ORM-RL (dashed red).
- Shaded regions (confidence intervals) are narrower for PAV-RL, indicating lower variance.
- **Key Data Points**:
- At 10³ iterations: PAV-RL ~0.22 vs. ORM-RL ~0.18.
- Final accuracy: PAV-RL ~0.24 vs. ORM-RL ~0.20.
#### Subplot (c): Sample Efficiency (9B)
- **Trend**:
- PAV-RL (solid orange) dominates ORM-RL (dashed red) throughout training.
- Shaded regions for PAV-RL are tighter, suggesting more stable convergence.
- **Key Data Points**:
- At 50×10² iterations: PAV-RL ~0.53 vs. ORM-RL ~0.47.
- Final accuracy: PAV-RL ~0.54 vs. ORM-RL ~0.48.
---
### Key Observations
1. **PAV-RL Superiority**: PAV-RL achieves higher accuracy and faster convergence than ORM-RL in all scenarios.
2. **Sample Efficiency**:
- PAV-RL requires **6× fewer iterations** (2B) and **5× fewer iterations** (9B) to reach comparable accuracy.
- Accuracy improvements of **7%** (2B) and **6%** (9B) for PAV-RL.
3. **Consistency**: PAV-RL’s performance is more stable, as indicated by narrower confidence intervals.
---
### Interpretation
The data demonstrates that **PAV-RL methods outperform ORM-RL in both accuracy and sample efficiency**, suggesting that value regularization (PAV-RL) enhances training stability and reduces computational costs. The **6× and 5× improvements** in sample efficiency highlight PAV-RL’s potential for practical applications where training resources are limited. The consistent performance across 2B and 9B base policies implies scalability, making PAV-RL a robust choice for RL tasks. The shaded regions in (b) and (c) further validate PAV-RL’s reliability, as its confidence intervals are tighter than ORM-RL’s.