## Bar Chart: Correlation of Different Aggregation Methods
### Overview
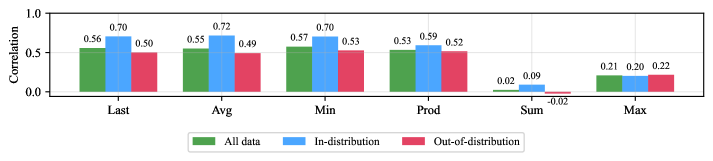
The image is a bar chart comparing the correlation of different aggregation methods ("Last", "Avg", "Min", "Prod", "Sum", "Max") across three data categories: "All data", "In-distribution", and "Out-of-distribution". The y-axis represents the correlation, ranging from 0.0 to 1.0. The chart visually displays how well each aggregation method correlates with the target variable for each data category.
### Components/Axes
* **X-axis:** Aggregation methods: "Last", "Avg", "Min", "Prod", "Sum", "Max".
* **Y-axis:** Correlation, ranging from 0.0 to 1.0, with gridlines at intervals of 0.5.
* **Legend:** Located at the bottom of the chart.
* Green: "All data"
* Blue: "In-distribution"
* Red: "Out-of-distribution"
### Detailed Analysis
Here's a breakdown of the correlation values for each aggregation method and data category:
* **Last:**
* All data (Green): 0.56
* In-distribution (Blue): 0.70
* Out-of-distribution (Red): 0.50
* **Avg:**
* All data (Green): 0.55
* In-distribution (Blue): 0.72
* Out-of-distribution (Red): 0.49
* **Min:**
* All data (Green): 0.57
* In-distribution (Blue): 0.70
* Out-of-distribution (Red): 0.53
* **Prod:**
* All data (Green): 0.53
* In-distribution (Blue): 0.59
* Out-of-distribution (Red): 0.52
* **Sum:**
* All data (Green): 0.02
* In-distribution (Blue): 0.09
* Out-of-distribution (Red): -0.02
* **Max:**
* All data (Green): 0.21
* In-distribution (Blue): 0.20
* Out-of-distribution (Red): 0.22
### Key Observations
* The "In-distribution" data (blue bars) generally shows the highest correlation across "Last", "Avg", and "Min" aggregation methods.
* The "Sum" aggregation method has very low correlation values for all data categories, with the "Out-of-distribution" data even showing a negative correlation.
* The "Max" aggregation method has low correlation values for all data categories.
* The "Avg" aggregation method has the highest correlation for "In-distribution" data (0.72).
### Interpretation
The chart suggests that using the "Last", "Avg", and "Min" aggregation methods on "In-distribution" data yields the strongest correlation with the target variable. The "Sum" aggregation method is a poor choice, as it shows almost no correlation and even a negative correlation for "Out-of-distribution" data. The "Max" aggregation method also shows a weak correlation. This information is valuable for selecting the most appropriate aggregation method based on the data distribution to achieve better predictive performance. The higher correlation of "In-distribution" data suggests that the model performs better on data it has been trained on, which is expected.