\n
## Bar Chart: Correlation of Metrics
### Overview
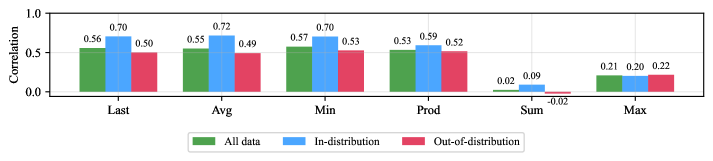
The image presents a bar chart comparing the correlation of several metrics ("Last", "Avg", "Min", "Prod", "Sum", "Max") across three data distributions: "All data", "In-distribution", and "Out-of-distribution". The y-axis represents the correlation value, ranging from 0.0 to 1.0. Each metric has three bars representing its correlation with each of the three data distributions.
### Components/Axes
* **X-axis:** Metric names: "Last", "Avg", "Min", "Prod", "Sum", "Max".
* **Y-axis:** Correlation, ranging from 0.0 to 1.0, with tick marks at 0.0, 0.25, 0.5, 0.75, and 1.0.
* **Legend:** Located at the bottom-center of the chart.
* Green: "All data"
* Blue: "In-distribution"
* Red: "Out-of-distribution"
### Detailed Analysis
The chart consists of six groups of three bars, one for each metric. The values above each bar represent the correlation coefficient.
* **Last:**
* All data: Approximately 0.56
* In-distribution: Approximately 0.70
* Out-of-distribution: Approximately 0.50
* **Avg:**
* All data: Approximately 0.55
* In-distribution: Approximately 0.72
* Out-of-distribution: Approximately 0.49
* **Min:**
* All data: Approximately 0.57
* In-distribution: Approximately 0.70
* Out-of-distribution: Approximately 0.53
* **Prod:**
* All data: Approximately 0.59
* In-distribution: Approximately 0.72
* Out-of-distribution: Approximately 0.52
* **Sum:**
* All data: Approximately 0.02
* In-distribution: Approximately 0.09
* Out-of-distribution: Approximately -0.02
* **Max:**
* All data: Approximately 0.21
* In-distribution: Approximately 0.20
* Out-of-distribution: Approximately 0.22
### Key Observations
* For most metrics ("Last", "Avg", "Min", "Prod"), the "In-distribution" data exhibits the highest correlation, followed by "All data", and then "Out-of-distribution".
* The "Sum" metric shows very low correlation values for all distributions, with the "Out-of-distribution" data having a slightly negative correlation.
* The "Max" metric has the lowest correlation values overall, with all distributions showing values around 0.2.
* The correlation values for "Max" are relatively consistent across all three distributions.
### Interpretation
The chart suggests that the metrics "Last", "Avg", "Min", and "Prod" are more strongly correlated with the "In-distribution" data than with the "All data" or "Out-of-distribution" data. This indicates that these metrics are more reliable for characterizing the in-distribution data. The "Sum" metric appears to have little correlation with any of the distributions, suggesting it may not be a useful feature for distinguishing between them. The "Max" metric shows a weak correlation across all distributions, indicating it is not particularly informative.
The difference in correlation between "In-distribution" and "Out-of-distribution" data could be used to identify outliers or anomalies. A significant drop in correlation for a particular metric when applied to "Out-of-distribution" data might indicate that the data point is not representative of the typical distribution. The negative correlation for "Sum" in the "Out-of-distribution" data is an interesting anomaly that warrants further investigation. It suggests that the sum of values tends to be lower for out-of-distribution data points, which could be due to a different distribution of values or the presence of negative values.