\n
## Grouped Bar Chart: Correlation by Aggregation Method and Data Distribution
### Overview
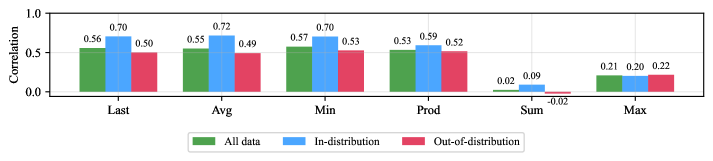
The image displays a grouped bar chart comparing correlation values across six different data aggregation methods (Last, Avg, Min, Prod, Sum, Max). For each method, three bars represent correlations calculated on different data subsets: "All data," "In-distribution," and "Out-of-distribution." The chart is designed to show how correlation strength varies by aggregation technique and data type.
### Components/Axes
* **Chart Type:** Grouped bar chart.
* **Y-Axis:**
* **Label:** "Correlation"
* **Scale:** Linear, ranging from 0.0 to 1.0.
* **Major Ticks:** 0.0, 0.5, 1.0.
* **X-Axis:**
* **Categories (Aggregation Methods):** "Last", "Avg", "Min", "Prod", "Sum", "Max".
* **Legend:**
* **Position:** Centered at the bottom of the chart.
* **Items:**
* Green square: "All data"
* Blue square: "In-distribution"
* Red square: "Out-of-distribution"
* **Data Labels:** Each bar has its numerical correlation value printed directly above it.
### Detailed Analysis
The following table reconstructs the data presented in the chart. Values are read directly from the labels above each bar.
| Aggregation Method | All data (Green) | In-distribution (Blue) | Out-of-distribution (Red) |
| :--- | :--- | :--- | :--- |
| **Last** | 0.56 | 0.70 | 0.50 |
| **Avg** | 0.55 | 0.72 | 0.49 |
| **Min** | 0.57 | 0.70 | 0.53 |
| **Prod** | 0.53 | 0.59 | 0.52 |
| **Sum** | 0.02 | 0.09 | -0.02 |
| **Max** | 0.21 | 0.20 | 0.22 |
**Trend Verification per Category:**
* **Last, Avg, Min, Prod:** For these four methods, the "In-distribution" (blue) bar is consistently the tallest, indicating the highest correlation. The "All data" (green) bar is the second tallest, and the "Out-of-distribution" (red) bar is the shortest. The values for "All data" and "Out-of-distribution" are relatively close to each other.
* **Sum:** This category is a significant outlier. All correlation values are near zero. The "In-distribution" value (0.09) is the highest but still very low. The "Out-of-distribution" value is slightly negative (-0.02).
* **Max:** This category shows a different pattern. The correlations are low (around 0.2) and very similar across all three data subsets, with "Out-of-distribution" (0.22) being marginally the highest.
### Key Observations
1. **Strongest Correlations:** The "Avg" (Average) aggregation method applied to "In-distribution" data yields the highest correlation in the chart (0.72). "Last" and "Min" are close behind at 0.70.
2. **Weakest Correlations:** The "Sum" aggregation method produces the weakest correlations, all below 0.1 in magnitude. This is a dramatic drop compared to the other methods.
3. **Distribution Impact:** For the first four methods (Last, Avg, Min, Prod), using only "In-distribution" data results in a clear boost in correlation (approximately +0.15 to +0.17) compared to using "All data" or "Out-of-distribution" data.
4. **Anomaly - Sum:** The "Sum" method's near-zero correlations suggest that summing the underlying data points destroys the linear relationship being measured, regardless of the data distribution.
5. **Anomaly - Max:** The "Max" method shows uniformly low correlations (~0.2) with negligible difference between data distributions, indicating it is a poor aggregator for preserving this specific correlation.
### Interpretation
This chart likely evaluates how different ways of summarizing time-series or grouped data (e.g., taking the last value, the average, the minimum) affect the strength of a measured correlation with a target variable.
The data suggests that **average-based aggregations ("Avg") are most effective at preserving a strong linear relationship**, especially when the data is "In-distribution" (i.e., matches the expected pattern the model was trained on). The significant performance drop for "Out-of-distribution" data in these categories highlights model sensitivity to data shift.
The **catastrophic failure of the "Sum" aggregator** is the most critical finding. It implies that the absolute magnitude of summed values is not informative for the correlation in question, or that the underlying data has properties (like varying scales or offsets) that make summation meaningless for this analysis. The "Max" aggregator also performs poorly, suggesting the peak values are not the informative feature.
From a technical document perspective, this chart would be used to justify selecting "Average" as the preferred aggregation method for a pipeline and to warn against using "Sum" or "Max." It also provides evidence that model performance (as measured by correlation) degrades on out-of-distribution data, which is a key consideration for deployment robustness.