## Line Charts: Model Performance on Math Problems
### Overview
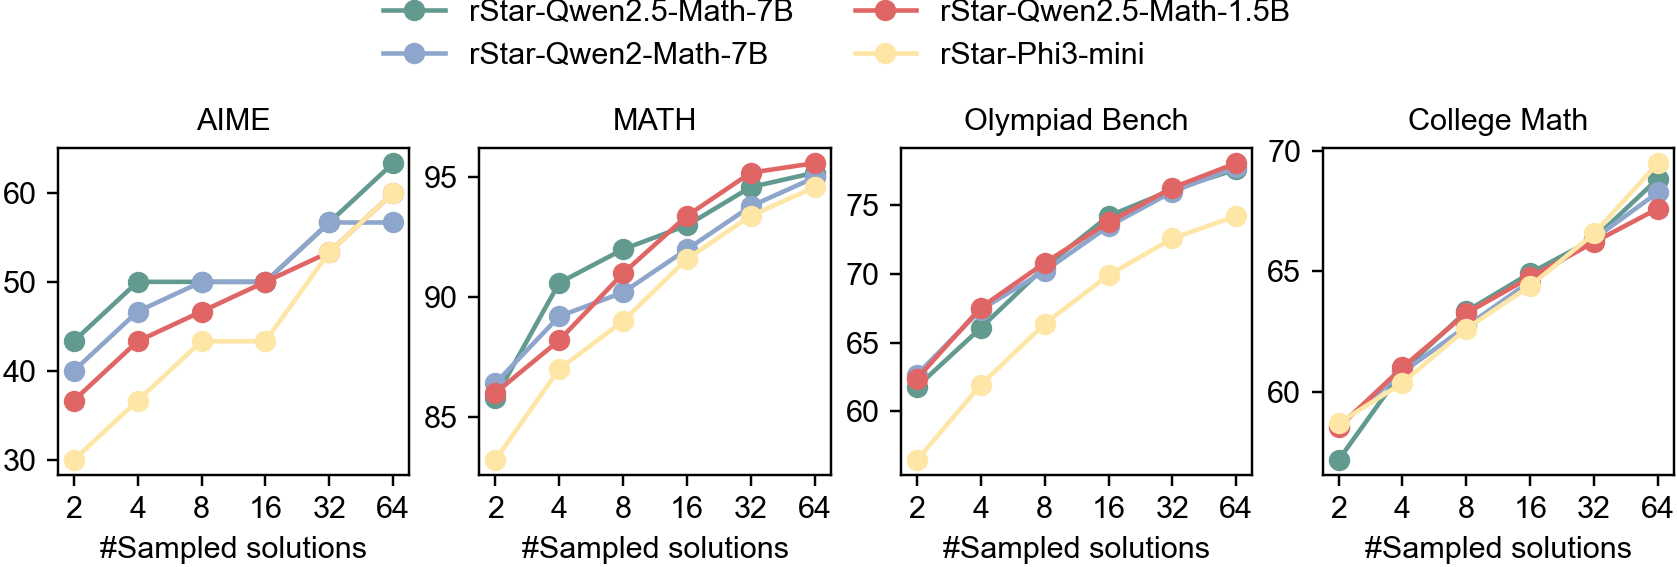
The image contains four line charts comparing the performance of four different language models (rStar-Qwen2.5-Math-7B, rStar-Qwen2-Math-7B, rStar-Qwen2.5-Math-1.5B, and rStar-Phi3-mini) on four different math problem datasets: AIME, MATH, Olympiad Bench, and College Math. The x-axis represents the number of sampled solutions (2, 4, 8, 16, 32, 64), and the y-axis represents the performance score.
### Components/Axes
* **Legend (Top):**
* Green: rStar-Qwen2.5-Math-7B
* Blue: rStar-Qwen2-Math-7B
* Red: rStar-Qwen2.5-Math-1.5B
* Yellow: rStar-Phi3-mini
* **X-axis (Horizontal):** "#Sampled solutions" with markers at 2, 4, 8, 16, 32, and 64.
* **Y-axis (Vertical):** Performance score. The scale varies for each chart.
* AIME: 30 to 60
* MATH: 85 to 95
* Olympiad Bench: 60 to 75
* College Math: 60 to 70
* **Chart Titles:** AIME, MATH, Olympiad Bench, College Math
### Detailed Analysis
**1. AIME**
* **rStar-Qwen2.5-Math-7B (Green):** Starts at approximately 42, increases to 50 at 4 sampled solutions, remains relatively flat at 50 until 16 sampled solutions, and then increases to approximately 63 at 64 sampled solutions.
* **rStar-Qwen2-Math-7B (Blue):** Starts at approximately 40, increases to 49 at 4 sampled solutions, remains relatively flat at 50 until 32 sampled solutions, and then increases to approximately 57 at 64 sampled solutions.
* **rStar-Qwen2.5-Math-1.5B (Red):** Starts at approximately 37, increases to 47 at 4 sampled solutions, remains relatively flat at 50 until 16 sampled solutions, and then increases to approximately 58 at 64 sampled solutions.
* **rStar-Phi3-mini (Yellow):** Starts at approximately 32, increases to 37 at 4 sampled solutions, increases to 42 at 8 sampled solutions, remains relatively flat at 43 until 16 sampled solutions, and then increases to approximately 55 at 64 sampled solutions.
**2. MATH**
* **rStar-Qwen2.5-Math-7B (Green):** Starts at approximately 86, increases to 91 at 4 sampled solutions, increases to 94 at 16 sampled solutions, and then increases to approximately 96 at 64 sampled solutions.
* **rStar-Qwen2-Math-7B (Blue):** Starts at approximately 87, increases to 89 at 4 sampled solutions, increases to 92 at 16 sampled solutions, and then increases to approximately 95 at 64 sampled solutions.
* **rStar-Qwen2.5-Math-1.5B (Red):** Starts at approximately 87, increases to 91 at 4 sampled solutions, increases to 94 at 16 sampled solutions, and then increases to approximately 96 at 64 sampled solutions.
* **rStar-Phi3-mini (Yellow):** Starts at approximately 83, increases to 88 at 4 sampled solutions, increases to 91 at 16 sampled solutions, and then increases to approximately 94 at 64 sampled solutions.
**3. Olympiad Bench**
* **rStar-Qwen2.5-Math-7B (Green):** Starts at approximately 62, increases to 67 at 4 sampled solutions, increases to 72 at 16 sampled solutions, and then increases to approximately 77 at 64 sampled solutions.
* **rStar-Qwen2-Math-7B (Blue):** Starts at approximately 62, increases to 68 at 4 sampled solutions, increases to 73 at 16 sampled solutions, and then increases to approximately 76 at 64 sampled solutions.
* **rStar-Qwen2.5-Math-1.5B (Red):** Starts at approximately 62, increases to 68 at 4 sampled solutions, increases to 74 at 16 sampled solutions, and then increases to approximately 77 at 64 sampled solutions.
* **rStar-Phi3-mini (Yellow):** Starts at approximately 58, increases to 62 at 4 sampled solutions, increases to 67 at 16 sampled solutions, and then increases to approximately 74 at 64 sampled solutions.
**4. College Math**
* **rStar-Qwen2.5-Math-7B (Green):** Starts at approximately 58, increases to 63 at 4 sampled solutions, increases to 66 at 16 sampled solutions, and then increases to approximately 69 at 64 sampled solutions.
* **rStar-Qwen2-Math-7B (Blue):** Starts at approximately 58, increases to 63 at 4 sampled solutions, increases to 66 at 16 sampled solutions, and then increases to approximately 68 at 64 sampled solutions.
* **rStar-Qwen2.5-Math-1.5B (Red):** Starts at approximately 58, increases to 63 at 4 sampled solutions, increases to 66 at 16 sampled solutions, and then increases to approximately 68 at 64 sampled solutions.
* **rStar-Phi3-mini (Yellow):** Starts at approximately 57, increases to 61 at 4 sampled solutions, increases to 64 at 16 sampled solutions, and then increases to approximately 67 at 64 sampled solutions.
### Key Observations
* All models generally improve in performance as the number of sampled solutions increases across all datasets.
* The rStar-Qwen2.5-Math-7B model (Green) generally performs the best or close to the best across all datasets.
* The rStar-Phi3-mini model (Yellow) generally performs the worst across all datasets, but still shows improvement with more sampled solutions.
* The performance difference between models is more pronounced on the AIME dataset compared to the other datasets.
### Interpretation
The data suggests that increasing the number of sampled solutions generally improves the performance of language models on math problem-solving tasks. The rStar-Qwen2.5-Math-7B model appears to be the most effective among the models tested, while the rStar-Phi3-mini model is the least effective. The AIME dataset seems to be more challenging, as the performance differences between the models are more apparent. The models converge towards similar performance levels on the MATH, Olympiad Bench, and College Math datasets, especially with a higher number of sampled solutions. This could indicate that these datasets are less sensitive to model architecture differences or that the models are approaching a performance ceiling on these tasks.