\n
## Line Chart: Performance of Language Models on Various Benchmarks
### Overview
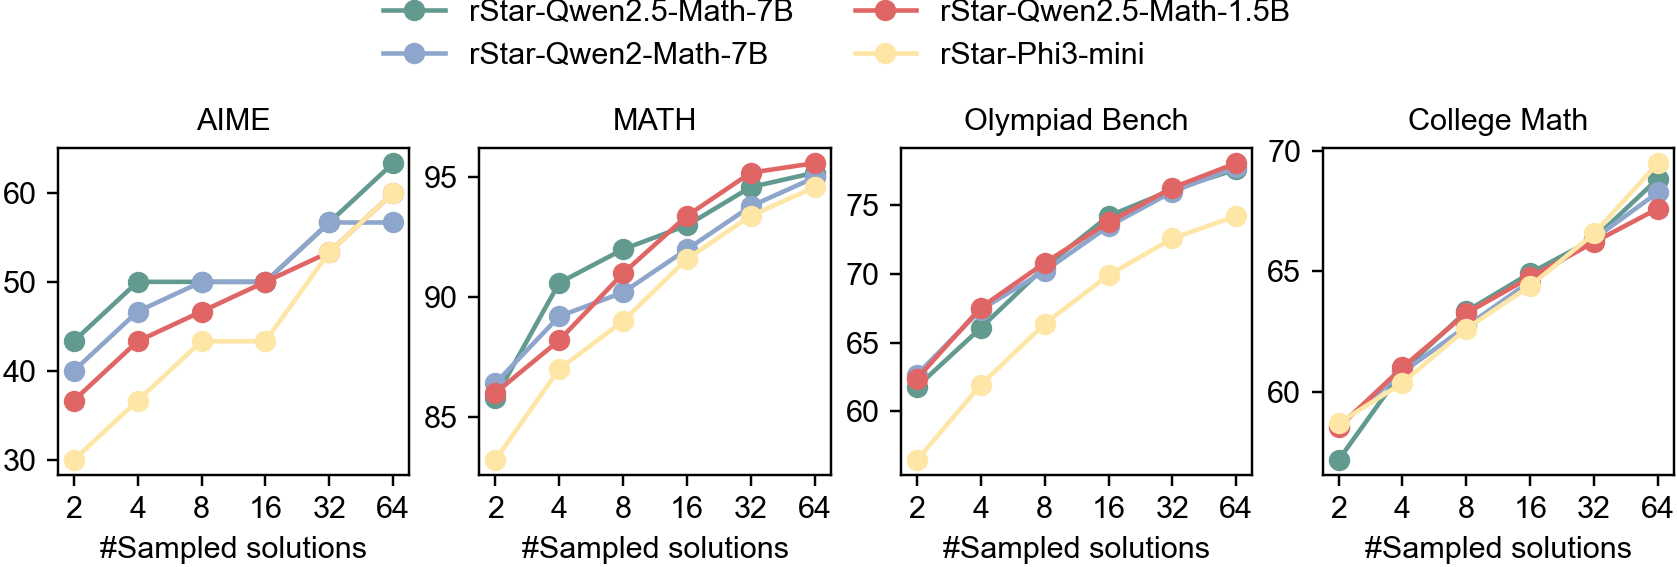
The image presents four line charts, each depicting the performance of different language models across varying numbers of sampled solutions. The charts compare the performance of rStar-Qwen2.5-Math-7B (grey line), rStar-Qwen2-Math-7B (blue line), rStar-Qwen2.5-Math-1.5B (green line), and rStar-Phi3-mini (orange line) on four distinct benchmarks: AIME, MATH, Olympiad Bench, and College Math. The x-axis represents the number of sampled solutions, ranging from 2 to 64, while the y-axis represents the performance score.
### Components/Axes
* **X-axis Label (all charts):** "#Sampled solutions"
* **Y-axis Label (all charts):** Performance Score (scales vary per chart)
* **Legend (top-right of the entire image):**
* rStar-Qwen2.5-Math-7B (Grey line)
* rStar-Qwen2-Math-7B (Blue line)
* rStar-Qwen2.5-Math-1.5B (Green line)
* rStar-Phi3-mini (Orange line)
* **Chart Titles (top-center of each chart):** AIME, MATH, Olympiad Bench, College Math.
### Detailed Analysis or Content Details
**AIME Chart:**
* The grey line (rStar-Qwen2.5-Math-7B) shows an upward trend, starting at approximately 34 at 2 sampled solutions and reaching around 62 at 64 sampled solutions.
* The blue line (rStar-Qwen2-Math-7B) begins at approximately 38 at 2 sampled solutions, rises sharply to around 58 at 16 sampled solutions, and plateaus around 62 at 64 sampled solutions.
* The green line (rStar-Qwen2.5-Math-1.5B) starts at around 32 at 2 sampled solutions, increases steadily to approximately 54 at 32 sampled solutions, and reaches around 58 at 64 sampled solutions.
* The orange line (rStar-Phi3-mini) begins at approximately 30 at 2 sampled solutions, rises to around 45 at 16 sampled solutions, and reaches approximately 52 at 64 sampled solutions.
**MATH Chart:**
* The grey line (rStar-Qwen2.5-Math-7B) shows a strong upward trend, starting at approximately 86 at 2 sampled solutions and reaching around 96 at 64 sampled solutions.
* The blue line (rStar-Qwen2-Math-7B) begins at approximately 84 at 2 sampled solutions, rises rapidly to around 94 at 16 sampled solutions, and plateaus around 96 at 64 sampled solutions.
* The green line (rStar-Qwen2.5-Math-1.5B) starts at around 82 at 2 sampled solutions, increases steadily to approximately 92 at 32 sampled solutions, and reaches around 94 at 64 sampled solutions.
* The orange line (rStar-Phi3-mini) begins at approximately 80 at 2 sampled solutions, rises to around 88 at 16 sampled solutions, and reaches approximately 92 at 64 sampled solutions.
**Olympiad Bench Chart:**
* The grey line (rStar-Qwen2.5-Math-7B) shows an upward trend, starting at approximately 58 at 2 sampled solutions and reaching around 74 at 64 sampled solutions.
* The blue line (rStar-Qwen2-Math-7B) begins at approximately 60 at 2 sampled solutions, rises to around 70 at 16 sampled solutions, and plateaus around 72 at 64 sampled solutions.
* The green line (rStar-Qwen2.5-Math-1.5B) starts at around 56 at 2 sampled solutions, increases steadily to approximately 68 at 32 sampled solutions, and reaches around 70 at 64 sampled solutions.
* The orange line (rStar-Phi3-mini) begins at approximately 54 at 2 sampled solutions, rises to around 64 at 16 sampled solutions, and reaches approximately 67 at 64 sampled solutions.
**College Math Chart:**
* The grey line (rStar-Qwen2.5-Math-7B) shows an upward trend, starting at approximately 60 at 2 sampled solutions and reaching around 70 at 64 sampled solutions.
* The blue line (rStar-Qwen2-Math-7B) begins at approximately 58 at 2 sampled solutions, rises to around 66 at 16 sampled solutions, and plateaus around 68 at 64 sampled solutions.
* The green line (rStar-Qwen2.5-Math-1.5B) starts at around 56 at 2 sampled solutions, increases steadily to approximately 65 at 32 sampled solutions, and reaches around 67 at 64 sampled solutions.
* The orange line (rStar-Phi3-mini) begins at approximately 54 at 2 sampled solutions, rises to around 62 at 16 sampled solutions, and reaches approximately 65 at 64 sampled solutions.
### Key Observations
* Across all benchmarks, increasing the number of sampled solutions generally improves performance for all models.
* rStar-Qwen2.5-Math-7B consistently performs the best, followed closely by rStar-Qwen2-Math-7B.
* rStar-Phi3-mini consistently performs the worst across all benchmarks.
* The performance gains from increasing sampled solutions diminish as the number of solutions increases, particularly for rStar-Qwen2-Math-7B.
* The MATH benchmark shows the highest overall performance scores, while AIME shows the lowest.
### Interpretation
The data demonstrates the impact of increasing sampled solutions on the performance of different language models across various mathematical benchmarks. The consistent outperformance of rStar-Qwen2.5-Math-7B suggests that model size and architecture play a significant role in problem-solving capabilities. The diminishing returns observed with increased sampling indicate a point of saturation where additional solutions provide minimal performance improvement. The differences in performance across benchmarks highlight the varying difficulty levels of the tasks. The results suggest that for optimal performance, a balance between model complexity and the number of sampled solutions is crucial. The consistent lower performance of rStar-Phi3-mini may indicate limitations in its architecture or training data compared to the other models.