## Line Graphs: Model Performance Across Benchmarks
### Overview
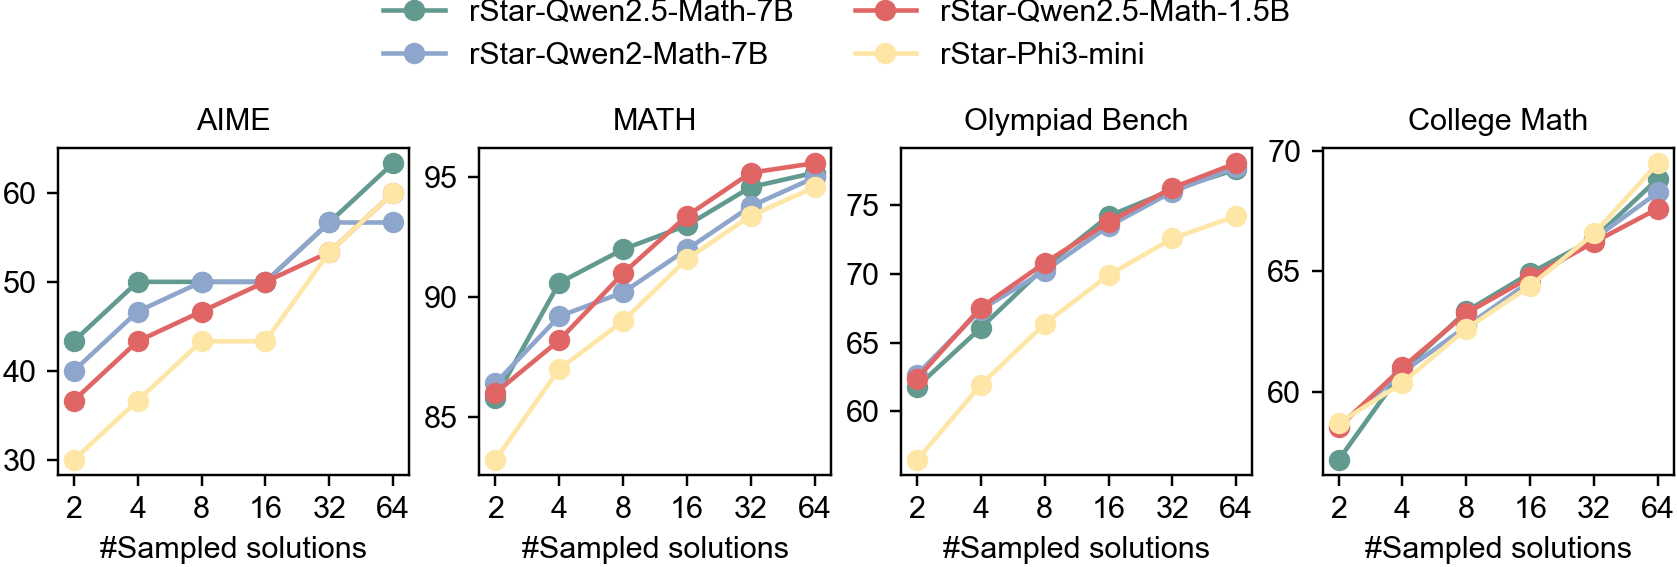
The image contains four line graphs comparing the performance of four AI models (rStar-Qwen2.5-Math-7B, rStar-Qwen2.5-Math-1.5B, rStar-Qwen2-Math-7B, and rStar-Phi3-mini) across four benchmarks: AIME, MATH, Olympiad Bench, and College Math. Each graph plots performance metrics (y-axis) against the number of sampled solutions (x-axis: 2, 4, 8, 16, 32, 64). The legend is positioned at the top, with colors mapped to models.
### Components/Axes
- **X-axis**: "#Sampled solutions" (values: 2, 4, 8, 16, 32, 64) across all graphs.
- **Y-axes**:
- AIME: 30–60
- MATH: 85–95
- Olympiad Bench: 60–75
- College Math: 55–70
- **Legend**: Top of the image, mapping colors to models:
- Green: rStar-Qwen2.5-Math-7B
- Red: rStar-Qwen2.5-Math-1.5B
- Blue: rStar-Qwen2-Math-7B
- Yellow: rStar-Phi3-mini
### Detailed Analysis
#### AIME
- **Green (rStar-Qwen2.5-Math-7B)**: Starts at ~40 (2 samples), rises to ~60 (64 samples).
- **Red (rStar-Qwen2.5-Math-1.5B)**: Starts at ~35, peaks at ~60.
- **Blue (rStar-Qwen2-Math-7B)**: Starts at ~40, plateaus at ~58.
- **Yellow (rStar-Phi3-mini)**: Starts at ~30, rises to ~60.
#### MATH
- **Green (rStar-Qwen2.5-Math-7B)**: Starts at ~85, peaks at ~95.
- **Red (rStar-Qwen2.5-Math-1.5B)**: Starts at ~80, peaks at ~95.
- **Blue (rStar-Qwen2-Math-7B)**: Starts at ~85, peaks at ~93.
- **Yellow (rStar-Phi3-mini)**: Starts at ~80, peaks at ~92.
#### Olympiad Bench
- **Green (rStar-Qwen2.5-Math-7B)**: Starts at ~60, peaks at ~75.
- **Red (rStar-Qwen2.5-Math-1.5B)**: Starts at ~65, peaks at ~75.
- **Blue (rStar-Qwen2-Math-7B)**: Starts at ~60, peaks at ~74.
- **Yellow (rStar-Phi3-mini)**: Starts at ~55, peaks at ~70.
#### College Math
- **Green (rStar-Qwen2.5-Math-7B)**: Starts at ~55, peaks at ~70.
- **Red (rStar-Qwen2.5-Math-1.5B)**: Starts at ~58, peaks at ~70.
- **Blue (rStar-Qwen2-Math-7B)**: Starts at ~55, peaks at ~69.
- **Yellow (rStar-Phi3-mini)**: Starts at ~50, peaks at ~70.
### Key Observations
1. **Performance Trends**: All models improve with more sampled solutions, but the rate of improvement varies.
2. **Model Size Impact**:
- 7B models (green/blue) generally outperform smaller models (red/yellow) in MATH and Olympiad Bench.
- Phi3-mini (yellow) shows the steepest improvement in AIME and College Math.
3. **Benchmark-Specific Patterns**:
- **MATH**: 7B models achieve near-peak performance early (e.g., ~95 by 16 samples).
- **Olympiad Bench**: Phi3-mini closes the gap with larger models by 64 samples.
- **College Math**: All models converge to similar performance (~65–70) at 64 samples.
### Interpretation
The data suggests that larger models (7B) excel in complex benchmarks like MATH, where accuracy is critical. Smaller models (1.5B/Phi3-mini) require more samples to match performance but demonstrate scalability. The Olympiad and College Math benchmarks highlight the importance of solution diversity, as Phi3-mini improves significantly with more samples. This implies that model size and sampling strategy are interdependent factors in optimizing performance across tasks.