## Line Chart: Test-Time Compute Scaling w.r.t. Problem Difficulty
### Overview
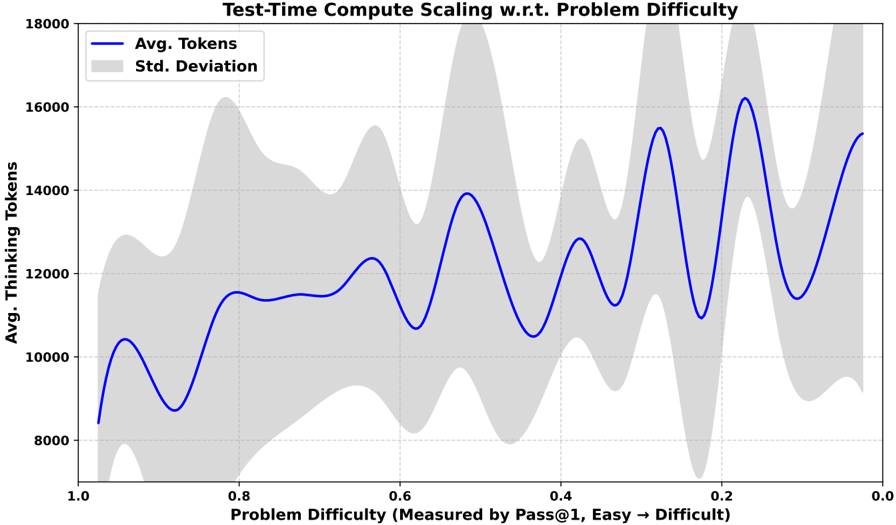
The image is a line chart that illustrates the relationship between problem difficulty and the average number of tokens, along with the standard deviation. The x-axis represents problem difficulty, measured by Pass@1, ranging from easy to difficult (1.0 to 0.0). The y-axis represents the average number of thinking tokens. The chart displays a blue line representing the average tokens and a gray area representing the standard deviation.
### Components/Axes
* **Title:** Test-Time Compute Scaling w.r.t. Problem Difficulty
* **X-Axis:**
* **Label:** Problem Difficulty (Measured by Pass@1, Easy → Difficult)
* **Scale:** 1.0, 0.8, 0.6, 0.4, 0.2, 0.0
* **Y-Axis:**
* **Label:** Avg. Thinking Tokens
* **Scale:** 8000, 10000, 12000, 14000, 16000, 18000
* **Legend:** Located in the top-left corner.
* **Blue Line:** Avg. Tokens
* **Gray Area:** Std. Deviation
### Detailed Analysis
* **Avg. Tokens (Blue Line):**
* The line starts at approximately 8500 tokens at a problem difficulty of 1.0.
* It rises to approximately 10500 tokens around 0.9 difficulty.
* It dips to approximately 8800 tokens around 0.8 difficulty.
* It rises to approximately 11500 tokens around 0.7 difficulty.
* It dips to approximately 10800 tokens around 0.6 difficulty.
* It rises to approximately 12500 tokens around 0.5 difficulty.
* It dips to approximately 10800 tokens around 0.4 difficulty.
* It rises to approximately 13000 tokens around 0.3 difficulty.
* It dips to approximately 9500 tokens around 0.2 difficulty.
* It rises to approximately 16000 tokens around 0.1 difficulty.
* It ends at approximately 15500 tokens at a problem difficulty of 0.0.
* Overall trend: The average number of tokens generally increases as the problem difficulty increases (from 1.0 to 0.0). The line fluctuates significantly.
* **Std. Deviation (Gray Area):**
* The gray area represents the standard deviation around the average number of tokens. The width of the gray area indicates the variability in the number of tokens for a given problem difficulty.
* The standard deviation appears to be relatively small at the extreme ends of the problem difficulty spectrum (1.0 and 0.0) and larger in the middle (around 0.4-0.6).
### Key Observations
* The average number of tokens generally increases as the problem difficulty increases (from easy to difficult).
* There are significant fluctuations in the average number of tokens across different problem difficulties.
* The standard deviation varies across different problem difficulties, suggesting that the variability in the number of tokens is not constant.
### Interpretation
The chart suggests that more difficult problems (lower Pass@1 values) generally require a larger number of tokens, indicating a higher computational load or more complex processing. The fluctuations in the average number of tokens may be due to variations in the types of problems or the specific algorithms used to solve them. The standard deviation provides insight into the consistency of the token count for problems of similar difficulty. A larger standard deviation suggests greater variability in the computational resources required for problems within that difficulty range.