\n
## Line Chart: Test-Time Compute Scaling w.r.t. Problem Difficulty
### Overview
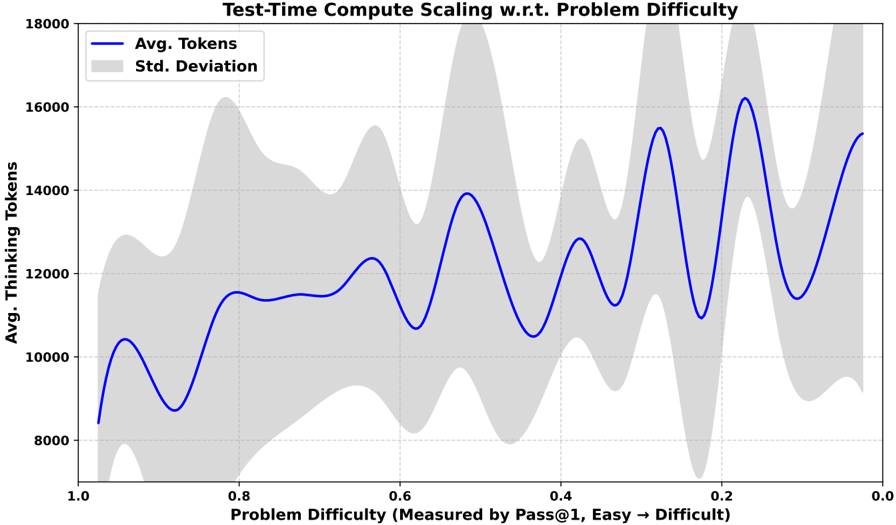
This line chart illustrates the relationship between problem difficulty and the average number of thinking tokens required during test-time compute. The chart also displays the standard deviation around the average. Problem difficulty is measured by Pass@1, where higher values indicate easier problems and lower values indicate more difficult problems.
### Components/Axes
* **Title:** "Test-Time Compute Scaling w.r.t. Problem Difficulty" (Top-center)
* **X-axis:** "Problem Difficulty (Measured by Pass@1, Easy → Difficult)" - Scale ranges from 1.0 (left) to 0.0 (right).
* **Y-axis:** "Avg. Thinking Tokens" - Scale ranges from 8000 (bottom) to 18000 (top).
* **Legend:** Located in the top-left corner.
* "Avg. Tokens" - Represented by a solid blue line.
* "Std. Deviation" - Represented by a shaded grey area.
### Detailed Analysis
The chart displays two data series: the average number of tokens and the standard deviation.
**Avg. Tokens (Blue Line):**
The blue line exhibits a complex, oscillating pattern.
* At x = 1.0, the average tokens is approximately 9,500.
* The line initially increases, reaching a peak of approximately 12,500 tokens at x = 0.8.
* It then decreases to around 11,000 tokens at x = 0.7.
* The line fluctuates between approximately 11,000 and 16,000 tokens for x values between 0.7 and 0.3.
* A peak of approximately 16,500 tokens is observed at x = 0.25.
* Finally, the line decreases to approximately 15,000 tokens at x = 0.0.
**Std. Deviation (Grey Shaded Area):**
The standard deviation varies significantly across the range of problem difficulties.
* At x = 1.0, the standard deviation is approximately 2,000 tokens.
* The standard deviation generally increases as problem difficulty decreases (x values decrease).
* The standard deviation reaches its maximum value (approximately 4,000 tokens) around x = 0.2.
* The standard deviation decreases slightly as x approaches 0.0, settling around 3,000 tokens.
### Key Observations
* The average number of tokens required appears to be higher for more difficult problems (lower Pass@1 values).
* The standard deviation is larger for more difficult problems, indicating greater variability in the number of tokens needed.
* The oscillating pattern of the average tokens suggests that the relationship between problem difficulty and compute is not linear. There are likely specific problem types within each difficulty level that require varying amounts of compute.
* The standard deviation is consistently above zero, indicating that there is always some degree of variability in the compute required for a given problem difficulty.
### Interpretation
The data suggests that as problem difficulty increases (Pass@1 decreases), the average compute required (measured in tokens) also tends to increase. However, this relationship is not straightforward; there are fluctuations indicating that other factors beyond overall difficulty influence compute requirements. The increasing standard deviation with difficulty suggests that predicting compute needs for harder problems is more challenging. This could be due to the increased complexity of these problems, leading to a wider range of solution paths and compute demands.
The oscillations in the average tokens line could be indicative of different categories of problems within each difficulty level. For example, some problems might require more reasoning steps, while others might require more memory access, leading to variations in token usage. Further analysis, potentially categorizing problems by type, could reveal more nuanced insights into the relationship between problem difficulty and compute scaling. The chart highlights the importance of considering both average compute requirements and variability when designing and optimizing systems for problem-solving tasks.