\n
## Line Chart with Confidence Band: Test-Time Compute Scaling w.r.t. Problem Difficulty
### Overview
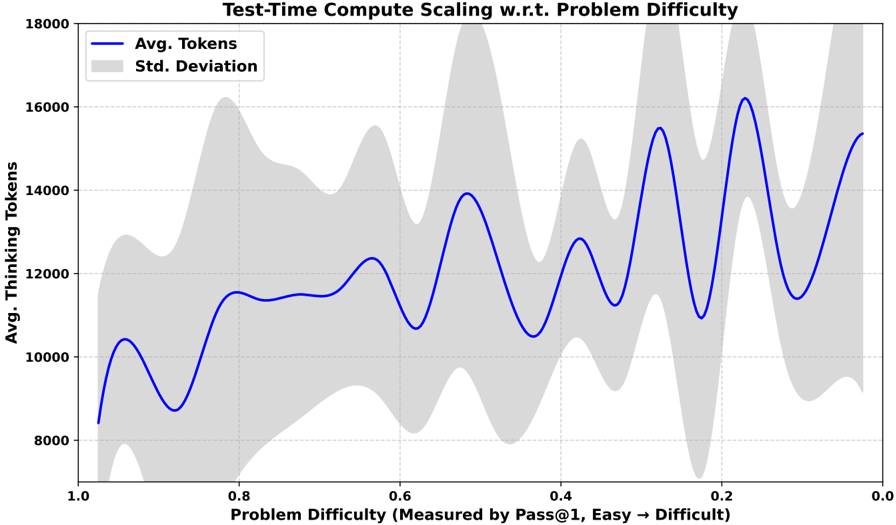
The image is a line chart titled "Test-Time Compute Scaling w.r.t. Problem Difficulty." It visualizes the relationship between the average number of "thinking tokens" used by a system and the difficulty of the problem it is solving. The chart includes a central trend line and a shaded region representing variability.
### Components/Axes
* **Title:** "Test-Time Compute Scaling w.r.t. Problem Difficulty" (Top center).
* **X-Axis (Horizontal):**
* **Label:** "Problem Difficulty (Measured by Pass@1, Easy → Difficult)"
* **Scale:** Reversed linear scale, running from 1.0 on the left to 0.0 on the right.
* **Major Tick Marks:** 1.0, 0.8, 0.6, 0.4, 0.2, 0.0.
* **Interpretation:** A higher Pass@1 score (closer to 1.0) indicates an easier problem. The axis explicitly states that difficulty increases from left (Easy) to right (Difficult).
* **Y-Axis (Vertical):**
* **Label:** "Avg. Thinking Tokens"
* **Scale:** Linear scale, ranging from 8000 to 18000.
* **Major Tick Marks:** 8000, 10000, 12000, 14000, 16000, 18000.
* **Legend:** Positioned in the top-left corner of the plot area.
* **Blue Line:** Labeled "Avg. Tokens"
* **Gray Shaded Area:** Labeled "Std. Deviation"
### Detailed Analysis
**Data Series: "Avg. Tokens" (Blue Line)**
* **Trend:** The line exhibits a clear, oscillatory upward trend as problem difficulty increases (moving from left to right on the x-axis). It is not a smooth increase but a series of peaks and valleys.
* **Approximate Data Points (at major x-axis ticks):**
* Difficulty 1.0 (Easiest): ~8,400 tokens.
* Difficulty 0.8: ~11,500 tokens (local peak).
* Difficulty 0.6: ~10,700 tokens (local valley).
* Difficulty 0.5 (midpoint between 0.6 and 0.4): ~13,900 tokens (major peak).
* Difficulty 0.4: ~10,500 tokens (local valley).
* Difficulty 0.3: ~15,500 tokens (major peak).
* Difficulty 0.2: ~11,000 tokens (local valley).
* Difficulty 0.15: ~16,200 tokens (highest peak).
* Difficulty 0.0 (Most Difficult): ~15,300 tokens.
**Data Series: "Std. Deviation" (Gray Shaded Area)**
* **Description:** This band represents the standard deviation around the average token count. Its width indicates the variability or spread of the data at each difficulty level.
* **Observation:** The band is relatively narrow for easier problems (left side, difficulty ~1.0 to 0.7). It becomes dramatically wider and more irregular for harder problems (right side, difficulty < 0.5), indicating much higher variance in the number of tokens used. The widest points of the band appear to align with the peaks in the average line, particularly around difficulties 0.5, 0.3, and 0.15.
### Key Observations
1. **Oscillatory Scaling:** The average compute (tokens) does not increase monotonically with difficulty. Instead, it follows a wave-like pattern with pronounced peaks and valleys.
2. **Increasing Variance:** The standard deviation grows substantially as problems become harder. This suggests that for difficult problems, the system's token usage is highly unpredictable—sometimes using a moderate amount and sometimes a very large amount.
3. **Peak Alignment:** The highest average token usage (peaks) occurs at specific, intermediate difficulty levels (e.g., ~0.5, ~0.3, ~0.15), not necessarily at the absolute hardest difficulty (0.0).
4. **Reversed Axis:** The x-axis is intentionally reversed to map "Easy" to the left and "Difficult" to the right, which is a common but important convention to note for correct interpretation.
### Interpretation
This chart demonstrates that the computational effort (measured in thinking tokens) required by the system scales in a non-linear and non-smooth fashion with problem difficulty. The oscillatory pattern suggests there may be distinct "regimes" or classes of problems where the system's reasoning process requires significantly more or less compute, even within a narrow band of measured difficulty.
The most critical insight is the exploding standard deviation for hard problems. This indicates a lack of robustness or consistency. While the *average* token count increases, the *experience* for any single hard problem is highly variable. This could mean the system sometimes finds an efficient solution path and other times gets stuck in a computationally expensive loop, leading to the wide spread. The peaks in average usage might correspond to problem types that are particularly challenging for the system's architecture, forcing extensive "thinking" regardless of the precise Pass@1 score. The data implies that managing performance on the hardest problems requires addressing this high variance, not just the average case.