# Technical Data Extraction: Heatmap Analysis of JS Divergence across Layers
## 1. Image Overview
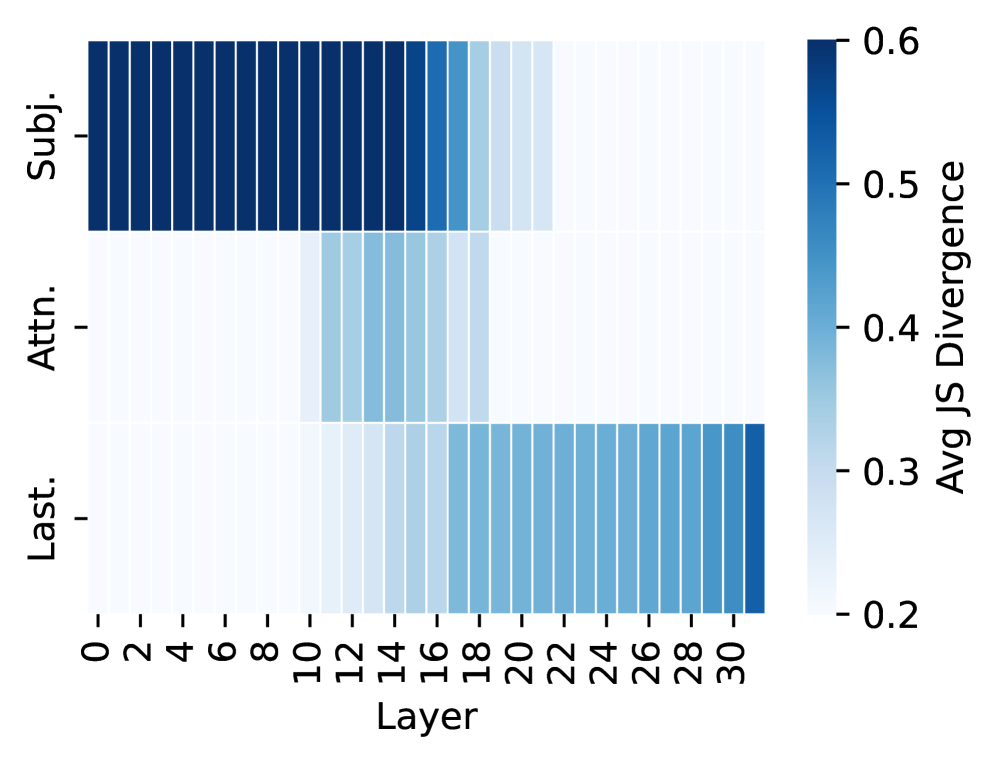
This image is a heatmap visualization representing the **Average Jensen-Shannon (JS) Divergence** across different layers of a neural network model (likely a Transformer-based model with 32 layers). The data is segmented by three distinct categories or components of the model.
## 2. Component Isolation
### A. Header / Axis Labels
* **Y-Axis (Categories):** Located on the left. Contains three labels:
* `Subj.` (Top row)
* `Attn.` (Middle row)
* `Last.` (Bottom row)
* **X-Axis (Layers):** Located at the bottom. Represents layer indices from 0 to 31.
* Markers are labeled every 2 units: `0, 2, 4, 6, 8, 10, 12, 14, 16, 18, 20, 22, 24, 26, 28, 30`.
* Axis Title: `Layer`
### B. Legend (Color Bar)
* **Spatial Placement:** Located on the far right.
* **Label:** `Avg JS Divergence`
* **Scale:** Linear gradient from light blue/white to dark navy blue.
* **Numerical Markers:** `0.2, 0.3, 0.4, 0.5, 0.6`.
* **Interpretation:** Darker blue indicates higher JS Divergence (~0.6), while white/light blue indicates lower JS Divergence (~0.2).
## 3. Data Extraction and Trend Verification
The heatmap is organized into three horizontal series. Each cell represents a specific layer for that category.
### Series 1: `Subj.` (Subject)
* **Visual Trend:** High divergence (dark blue) in the early layers, followed by a sharp decline (fading to white) in the middle-to-late layers.
* **Data Points:**
* **Layers 0–15:** Consistently high divergence, appearing at the maximum value of approximately **0.6**.
* **Layer 16:** Slight decrease (~0.5).
* **Layer 17:** Moderate decrease (~0.45).
* **Layer 18:** Significant drop (~0.35).
* **Layers 19–21:** Low divergence (~0.25–0.3).
* **Layers 22–31:** Minimum divergence, appearing near the baseline of **0.2**.
### Series 2: `Attn.` (Attention)
* **Visual Trend:** Low divergence throughout most of the model, with a localized "bump" or increase in divergence specifically in the middle layers.
* **Data Points:**
* **Layers 0–10:** Minimum divergence (~0.2).
* **Layers 11–18:** Increased divergence. The peak occurs around layers 13–15, reaching approximately **0.35 to 0.4**.
* **Layers 19–31:** Returns to minimum divergence (~0.2).
### Series 3: `Last.` (Last/Final)
* **Visual Trend:** Low divergence in the early and middle layers, with a steady increase starting from the middle and peaking at the very final layer.
* **Data Points:**
* **Layers 0–10:** Minimum divergence (~0.2).
* **Layers 11–16:** Very slight, gradual increase (~0.22–0.25).
* **Layers 17–30:** Sustained moderate divergence, plateauing around **0.4**.
* **Layer 31:** Sharp increase to the highest value for this series, approximately **0.55**.
## 4. Summary Table of Key Observations
| Category | Peak Divergence Phase | Peak Value (Approx) | Low Divergence Phase |
| :--- | :--- | :--- | :--- |
| **Subj.** | Early Layers (0-15) | 0.6 | Late Layers (22-31) |
| **Attn.** | Middle Layers (11-18) | 0.4 | Early & Late Layers |
| **Last.** | Final Layers (17-31) | 0.55 (at Layer 31) | Early Layers (0-10) |
## 5. Technical Conclusion
The visualization demonstrates a clear transition of information or "divergence" through the model's depth. The **Subject** component is most active/divergent in the initial half of the model, the **Attention** component shows a specific localized divergence in the center, and the **Last** component (likely referring to final token or output representations) becomes dominant in the latter half of the network.