\n
## Heatmap: Average Jensen-Shannon Divergence by Layer and Subject
### Overview
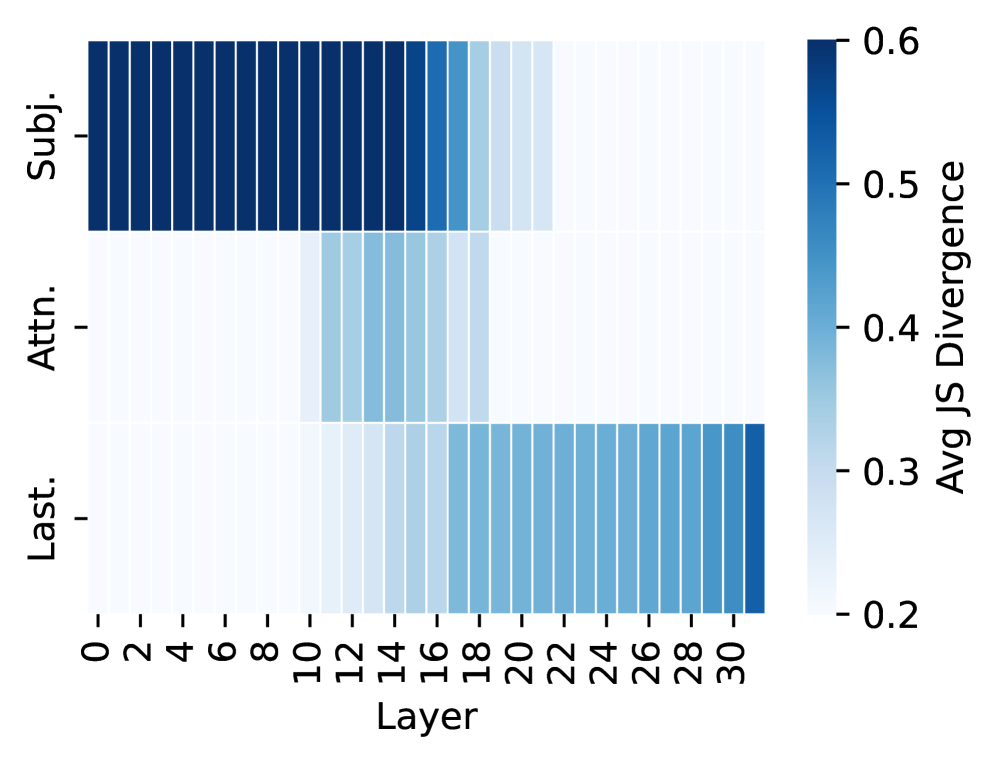
This image presents a heatmap visualizing the average Jensen-Shannon (JS) Divergence across different layers of a model, categorized by subject (Subj.), attention (Attn.), and last layer (Last.). The heatmap displays the relationship between layer number and JS divergence, with color intensity representing the divergence value.
### Components/Axes
* **X-axis:** Layer, ranging from 0 to 30, with increments of 2.
* **Y-axis:** Categories: "Subj." (Subject), "Attn." (Attention), and "Last." (Last Layer). These are listed vertically.
* **Color Scale:** A gradient from dark blue to light blue to white, representing JS Divergence values. The scale ranges from 0.2 to 0.6.
* **Title:** Not explicitly present, but the chart represents "Avg JS Divergence".
### Detailed Analysis
The heatmap is structured into three horizontal bands, one for each category (Subj., Attn., Last.). Each cell in the heatmap represents the average JS divergence for a specific layer and category.
**Subject (Subj.):**
* The JS divergence is consistently high (approximately 0.55-0.6) from layer 0 to layer 10.
* A sharp decrease in JS divergence is observed between layer 10 and layer 12, dropping to approximately 0.4.
* From layer 12 to layer 30, the JS divergence gradually decreases, reaching a value of approximately 0.25-0.3.
**Attention (Attn.):**
* The JS divergence starts at approximately 0.4 at layer 0.
* It remains relatively stable until layer 12, where it begins to decrease.
* From layer 12 to layer 30, the JS divergence decreases steadily, reaching a value of approximately 0.2.
**Last Layer (Last.):**
* The JS divergence starts at approximately 0.3 at layer 0.
* It remains relatively stable until layer 16, where it begins to decrease.
* From layer 16 to layer 30, the JS divergence decreases steadily, reaching a value of approximately 0.2.
### Key Observations
* The "Subject" category exhibits the highest JS divergence values overall, particularly in the initial layers.
* All three categories show a decreasing trend in JS divergence as the layer number increases.
* The rate of decrease in JS divergence appears to be most rapid for the "Subject" category.
* The "Last Layer" category has the lowest JS divergence values.
### Interpretation
The heatmap suggests that the representations learned by the model become more consistent (lower JS divergence) as information propagates through deeper layers. The higher JS divergence in the initial layers for the "Subject" category might indicate that the model initially struggles to establish a stable representation of the subject, but this representation becomes more refined with increasing depth. The decreasing trend across all categories suggests that the model is converging towards more consistent representations as it processes information. The "Last Layer" consistently showing the lowest divergence suggests that the final layer provides the most stable and consistent representation. The differences in divergence values between the categories could reflect the varying degrees of complexity or importance of each category in the model's learning process. The rapid drop in divergence around layers 10-16 could indicate a significant shift in the model's learning dynamics at that point.