## Line Chart: MER Average vs N
### Overview
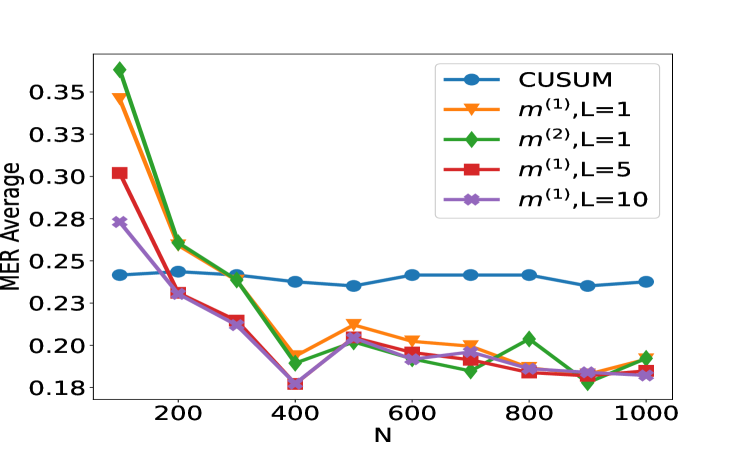
The image is a line chart comparing the MER (Minimum Error Rate) Average for different methods (CUSUM, m^(1), m^(2)) with varying parameters (L=1, L=5, L=10) against the variable N. The chart displays how the MER Average changes as N increases from 0 to 1000.
### Components/Axes
* **X-axis:** N, ranging from 0 to 1000, with markers at 200, 400, 600, 800, and 1000.
* **Y-axis:** MER Average, ranging from 0.18 to 0.35, with markers at 0.18, 0.20, 0.23, 0.25, 0.28, 0.30, 0.33, and 0.35.
* **Legend (Top-Right):**
* Blue line with circle markers: CUSUM
* Orange line with triangle markers: m^(1), L=1
* Green line with diamond markers: m^(2), L=1
* Red line with square markers: m^(1), L=5
* Purple line with cross markers: m^(1), L=10
### Detailed Analysis
* **CUSUM (Blue):** The line is relatively flat, indicating a stable MER Average.
* At N=100, MER Average is approximately 0.24.
* At N=1000, MER Average is approximately 0.24.
* **m^(1), L=1 (Orange):** The line starts high and decreases sharply before leveling off.
* At N=100, MER Average is approximately 0.35.
* At N=400, MER Average is approximately 0.19.
* At N=1000, MER Average is approximately 0.20.
* **m^(2), L=1 (Green):** Similar to the orange line, it decreases sharply and then fluctuates.
* At N=100, MER Average is approximately 0.36.
* At N=400, MER Average is approximately 0.19.
* At N=1000, MER Average is approximately 0.20.
* **m^(1), L=5 (Red):** The line also decreases and then stabilizes.
* At N=100, MER Average is approximately 0.30.
* At N=400, MER Average is approximately 0.21.
* At N=1000, MER Average is approximately 0.19.
* **m^(1), L=10 (Purple):** This line shows a similar trend of decreasing and then stabilizing.
* At N=100, MER Average is approximately 0.28.
* At N=400, MER Average is approximately 0.18.
* At N=1000, MER Average is approximately 0.19.
### Key Observations
* The CUSUM method maintains a relatively constant MER Average across all values of N.
* The other methods (m^(1), m^(2)) show a significant decrease in MER Average as N increases from 100 to around 400, after which they stabilize.
* The MER Average for m^(1) with L=1, 5, and 10, and m^(2) with L=1 converge to similar values as N approaches 1000.
### Interpretation
The chart suggests that the CUSUM method provides a more stable MER Average regardless of the value of N. The other methods, particularly m^(1) and m^(2), are initially more sensitive to changes in N, but their performance stabilizes as N increases. The choice of method and parameters (L) may depend on the specific application and the desired trade-off between initial sensitivity and long-term stability. The convergence of m^(1) and m^(2) methods at higher N values indicates that the impact of the parameter L diminishes as N increases.