## Line Chart: MER Average vs. N for Different Methods
### Overview
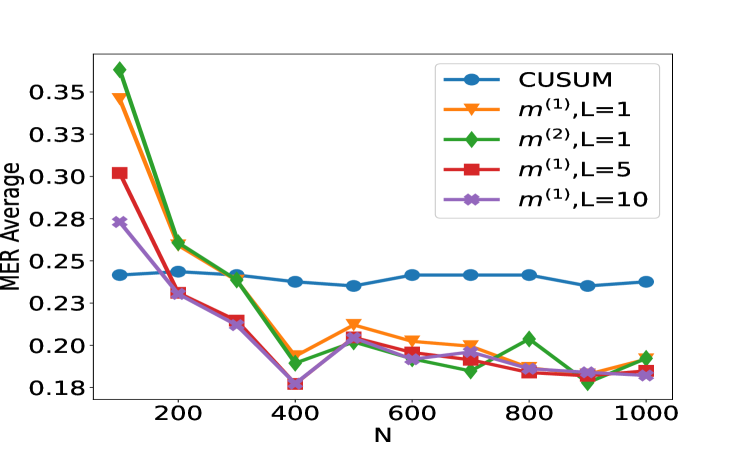
This image is a line chart displaying the "MER Average" on the y-axis against "N" on the x-axis. Five different data series, representing different methods or configurations, are plotted. The chart shows how the MER Average changes as N increases from approximately 100 to 1000.
### Components/Axes
* **Y-axis Label**: "MER Average"
* **Scale**: Linear, ranging from approximately 0.18 to 0.36.
* **Tick Marks**: 0.18, 0.20, 0.22, 0.24, 0.26, 0.28, 0.30, 0.32, 0.34, 0.35.
* **X-axis Label**: "N"
* **Scale**: Linear, ranging from approximately 100 to 1000.
* **Tick Marks**: 200, 400, 600, 800, 1000.
* **Legend**: Located in the top-right quadrant of the chart. It maps colors and markers to different data series:
* **Blue circles**: CUSUM
* **Orange inverted triangles**: $m^{(1)}, L=1$
* **Green diamonds**: $m^{(2)}, L=1$
* **Red squares**: $m^{(1)}, L=5$
* **Purple crosses**: $m^{(1)}, L=10$
### Detailed Analysis or Content Details
The chart displays data points at approximate N values of 100, 200, 300, 400, 500, 600, 700, 800, 900, and 1000.
**1. CUSUM (Blue circles):**
* **Trend**: This series shows a relatively stable trend, starting around 0.24, slightly decreasing to around 0.235, then increasing to around 0.245, and fluctuating between 0.24 and 0.245 for the rest of the N values.
* **Data Points (approximate N, MER Average):**
* (100, 0.24)
* (200, 0.245)
* (300, 0.235)
* (400, 0.24)
* (500, 0.245)
* (600, 0.245)
* (700, 0.24)
* (800, 0.245)
* (900, 0.24)
* (1000, 0.24)
**2. $m^{(1)}, L=1$ (Orange inverted triangles):**
* **Trend**: This series starts at a high MER Average of approximately 0.35 at N=100, then sharply decreases to around 0.25 at N=200, and continues to decrease to around 0.19 at N=400. It then fluctuates between approximately 0.20 and 0.22 before ending around 0.195 at N=1000.
* **Data Points (approximate N, MER Average):**
* (100, 0.35)
* (200, 0.25)
* (300, 0.21)
* (400, 0.19)
* (500, 0.205)
* (600, 0.22)
* (700, 0.20)
* (800, 0.215)
* (900, 0.195)
* (1000, 0.195)
**3. $m^{(2)}, L=1$ (Green diamonds):**
* **Trend**: This series begins at approximately 0.36 at N=100, drops significantly to around 0.26 at N=200, and further to around 0.22 at N=300. It then fluctuates, reaching a low of around 0.19 at N=400, then rising to around 0.205 at N=500, dropping to 0.19 at N=700, rising to 0.205 at N=800, and ending around 0.195 at N=1000.
* **Data Points (approximate N, MER Average):**
* (100, 0.36)
* (200, 0.26)
* (300, 0.22)
* (400, 0.19)
* (500, 0.205)
* (600, 0.19)
* (700, 0.185)
* (800, 0.205)
* (900, 0.185)
* (1000, 0.195)
**4. $m^{(1)}, L=5$ (Red squares):**
* **Trend**: This series starts at approximately 0.30 at N=100, drops to around 0.23 at N=200, and continues to decrease to around 0.21 at N=300. It then fluctuates between approximately 0.19 and 0.22, ending around 0.185 at N=1000.
* **Data Points (approximate N, MER Average):**
* (100, 0.30)
* (200, 0.23)
* (300, 0.21)
* (400, 0.22)
* (500, 0.205)
* (600, 0.215)
* (700, 0.195)
* (800, 0.185)
* (900, 0.19)
* (1000, 0.185)
**5. $m^{(1)}, L=10$ (Purple crosses):**
* **Trend**: This series begins at approximately 0.28 at N=100, drops to around 0.23 at N=200, and further to around 0.18 at N=300. It then fluctuates between approximately 0.18 and 0.21, ending around 0.19 at N=1000.
* **Data Points (approximate N, MER Average):**
* (100, 0.28)
* (200, 0.23)
* (300, 0.18)
* (400, 0.19)
* (500, 0.205)
* (600, 0.195)
* (700, 0.21)
* (800, 0.185)
* (900, 0.19)
* (1000, 0.19)
### Key Observations
* **Initial High Values**: The methods $m^{(2)}, L=1$, $m^{(1)}, L=1$, and $m^{(1)}, L=5$ all start with significantly higher MER Average values at N=100 compared to CUSUM and $m^{(1)}, L=10$.
* **Rapid Decrease**: For most methods (except CUSUM), there is a sharp decrease in MER Average as N increases from 100 to around 300-400.
* **Convergence/Stabilization**: After the initial drop, most of the methods (except CUSUM, which is already relatively stable) tend to converge to lower MER Average values, generally between 0.18 and 0.22, as N increases towards 1000.
* **CUSUM Stability**: The CUSUM method exhibits the most stable MER Average across the range of N, fluctuating only slightly around 0.24.
* **Lowest Values**: The lowest MER Average values (around 0.18-0.19) are achieved by $m^{(1)}, L=5$, $m^{(1)}, L=10$, and $m^{(2)}, L=1$ at various points for N >= 300.
### Interpretation
The chart suggests that for the tested methods, the "MER Average" generally decreases as the parameter "N" increases, especially in the initial range of N. This indicates that a larger sample size or a longer observation period (represented by N) might lead to a more stable or accurate measurement of MER (likely Mean Error Rate or a similar metric).
The CUSUM method appears to be the most robust or least sensitive to changes in N, maintaining a consistent MER Average. In contrast, the other methods, particularly $m^{(1)}, L=1$ and $m^{(2)}, L=1$, show a significant improvement (reduction in MER Average) as N increases from 100. The parameter L (which might represent a lookback window or a similar parameter) also seems to influence the performance, with $m^{(1)}, L=5$ and $m^{(1)}, L=10$ generally achieving lower MER averages than $m^{(1)}, L=1$ for larger N.
The initial high MER Average values for some methods at small N could indicate instability or a higher rate of errors when the system is less observed. The subsequent decrease suggests that with more data, the methods become more adept at identifying or mitigating errors, leading to a lower average error rate. The convergence of several lines at lower MER Average values for larger N implies that beyond a certain point, increasing N might yield diminishing returns in terms of MER reduction for these specific methods.