# Technical Document Analysis of Chart
## Title
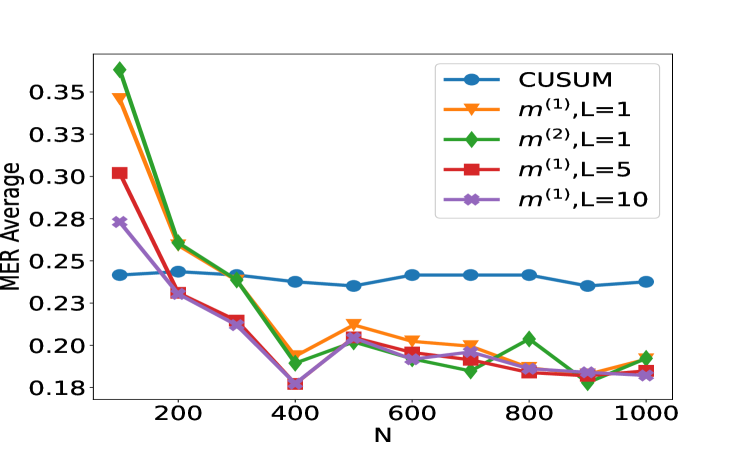
- **Chart Title**: "MER Average"
## Axes
- **X-Axis**:
- Label: "N"
- Range: 200 to 1000 (increments of 200)
- **Y-Axis**:
- Label: "MER Average"
- Range: 0.18 to 0.35 (increments of 0.01)
## Legend
- **Position**: Top-right corner
- **Entries**:
1. **CUSUM** (Blue, Circle marker)
2. **m^(1),L=1** (Orange, Triangle marker)
3. **m^(2),L=1** (Green, Diamond marker)
4. **m^(1),L=5** (Red, Square marker)
5. **m^(1),L=10** (Purple, Star marker)
## Data Series & Trends
1. **CUSUM (Blue)**:
- **Trend**: Relatively flat line with minor fluctuations.
- **Key Points**:
- Starts at ~0.24 (N=200)
- Dips slightly to ~0.23 (N=400)
- Stabilizes around 0.23–0.24 for N ≥ 600.
2. **m^(1),L=1 (Orange)**:
- **Trend**: Sharp initial decline, then gradual stabilization.
- **Key Points**:
- Starts at ~0.34 (N=200)
- Drops to ~0.20 (N=400)
- Fluctuates between 0.19–0.21 for N ≥ 600.
3. **m^(2),L=1 (Green)**:
- **Trend**: Steep initial drop, followed by volatility.
- **Key Points**:
- Starts at ~0.36 (N=200)
- Plummets to ~0.20 (N=400)
- Oscillates between 0.18–0.22 for N ≥ 600.
4. **m^(1),L=5 (Red)**:
- **Trend**: Moderate decline, then stabilization.
- **Key Points**:
- Starts at ~0.30 (N=200)
- Decreases to ~0.19 (N=400)
- Stabilizes around 0.18–0.20 for N ≥ 600.
5. **m^(1),L=10 (Purple)**:
- **Trend**: Gradual decline with minor fluctuations.
- **Key Points**:
- Starts at ~0.28 (N=200)
- Drops to ~0.18 (N=400)
- Remains flat around 0.18–0.19 for N ≥ 600.
## Spatial Grounding & Validation
- **Legend Colors Match Data Points**:
- Blue (CUSUM) matches all blue circles.
- Orange (m^(1),L=1) matches all orange triangles.
- Green (m^(2),L=1) matches all green diamonds.
- Red (m^(1),L=5) matches all red squares.
- Purple (m^(1),L=10) matches all purple stars.
## Conclusion
The chart illustrates the performance of five statistical methods (CUSUM, m^(1),L=1, m^(2),L=1, m^(1),L=5, m^(1),L=10) across varying sample sizes (N). CUSUM demonstrates the most stability, while m^(2),L=1 exhibits the highest initial variability. All methods converge toward lower MER averages as N increases, with m^(1),L=10 showing the most consistent decline.