## Chart: Pass Rate vs. Temperature for Different Token Sizes
### Overview
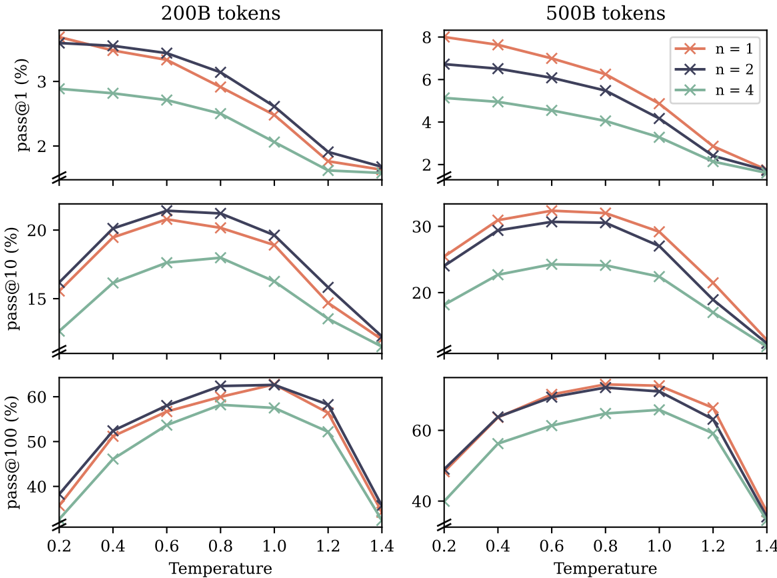
The image presents six line charts arranged in a 3x2 grid. Each chart plots the "pass" rate (pass@1, pass@10, pass@100) as a function of "Temperature" for two different token sizes (200B and 500B). Each chart contains three lines representing different values of 'n' (n=1, n=2, n=4). The x-axis represents temperature, and the y-axis represents the pass rate in percentage.
### Components/Axes
* **Titles:**
* Top-left chart title: "200B tokens"
* Top-right chart title: "500B tokens"
* **X-axis:**
* Label: "Temperature"
* Scale: 0.2, 0.4, 0.6, 0.8, 1.0, 1.2, 1.4
* **Y-axis (Left Column):**
* Top chart label: "pass@1 (%)"
* Middle chart label: "pass@10 (%)"
* Bottom chart label: "pass@100 (%)"
* Scale (pass@1): 2, 3
* Scale (pass@10): 15, 20
* Scale (pass@100): 40, 50, 60
* **Y-axis (Right Column):**
* Top chart label: "pass@1 (%)"
* Middle chart label: "pass@10 (%)"
* Bottom chart label: "pass@100 (%)"
* Scale (pass@1): 2, 4, 6, 8
* Scale (pass@10): 20, 30
* Scale (pass@100): 40, 50, 60
* **Legend (Located at the bottom-right of the image):**
* n = 1 (coral/light orange)
* n = 2 (dark blue)
* n = 4 (light green)
### Detailed Analysis
**200B tokens**
* **pass@1 (%)**
* n = 1 (coral): Starts at approximately 3.6%, decreases to approximately 1.6% as temperature increases.
* n = 2 (dark blue): Starts at approximately 3.2%, decreases to approximately 1.5% as temperature increases.
* n = 4 (light green): Starts at approximately 3.0%, decreases to approximately 1.2% as temperature increases.
* **pass@10 (%)**
* n = 1 (coral): Starts at approximately 16%, increases to approximately 21% at temperature 0.6, then decreases to approximately 12% as temperature increases.
* n = 2 (dark blue): Starts at approximately 16%, increases to approximately 22% at temperature 0.6, then decreases to approximately 12% as temperature increases.
* n = 4 (light green): Starts at approximately 12%, increases to approximately 18% at temperature 0.6, then decreases to approximately 10% as temperature increases.
* **pass@100 (%)**
* n = 1 (coral): Starts at approximately 40%, increases to approximately 60% at temperature 0.8, then decreases to approximately 35% as temperature increases.
* n = 2 (dark blue): Starts at approximately 40%, increases to approximately 62% at temperature 0.8, then decreases to approximately 35% as temperature increases.
* n = 4 (light green): Starts at approximately 38%, increases to approximately 58% at temperature 0.8, then decreases to approximately 32% as temperature increases.
**500B tokens**
* **pass@1 (%)**
* n = 1 (coral): Starts at approximately 8%, decreases to approximately 2% as temperature increases.
* n = 2 (dark blue): Starts at approximately 7%, decreases to approximately 2% as temperature increases.
* n = 4 (light green): Starts at approximately 5%, decreases to approximately 1.8% as temperature increases.
* **pass@10 (%)**
* n = 1 (coral): Starts at approximately 27%, increases to approximately 32% at temperature 0.6, then decreases to approximately 12% as temperature increases.
* n = 2 (dark blue): Starts at approximately 25%, increases to approximately 32% at temperature 0.6, then decreases to approximately 12% as temperature increases.
* n = 4 (light green): Starts at approximately 18%, increases to approximately 24% at temperature 0.6, then decreases to approximately 10% as temperature increases.
* **pass@100 (%)**
* n = 1 (coral): Starts at approximately 50%, increases to approximately 70% at temperature 0.6, then decreases to approximately 35% as temperature increases.
* n = 2 (dark blue): Starts at approximately 50%, increases to approximately 70% at temperature 0.6, then decreases to approximately 35% as temperature increases.
* n = 4 (light green): Starts at approximately 48%, increases to approximately 62% at temperature 0.6, then decreases to approximately 35% as temperature increases.
### Key Observations
* For pass@1, the pass rate decreases as temperature increases for all values of 'n' and both token sizes.
* For pass@10 and pass@100, the pass rate initially increases with temperature, reaches a peak around temperature 0.6-0.8, and then decreases as temperature further increases.
* Generally, higher values of 'n' result in lower pass rates for all temperature values.
* The 500B token models generally have higher pass rates than the 200B token models.
### Interpretation
The charts illustrate the relationship between temperature, the parameter 'n', and the pass rate of a language model for different token sizes. The pass rate measures the model's ability to generate correct code.
* **Temperature:** The temperature parameter controls the randomness of the model's output. Lower temperatures lead to more deterministic and predictable outputs, while higher temperatures introduce more randomness. The observed trends suggest that an intermediate temperature (around 0.6-0.8) is optimal for pass@10 and pass@100, balancing exploration and exploitation in the generation process. For pass@1, lower temperatures are better.
* **Parameter 'n':** The parameter 'n' likely represents the number of samples generated by the model. Lower values of 'n' (e.g., n=1) generally lead to higher pass rates, suggesting that focusing on generating a smaller number of high-quality samples is more effective than generating a larger number of samples with potentially lower quality.
* **Token Size:** The 500B token models consistently outperform the 200B token models, indicating that models trained on larger datasets have a better ability to generate correct code.