## Line Charts: Model Performance (pass@k) vs. Temperature for Different Training Token Counts and Sampling Settings
### Overview
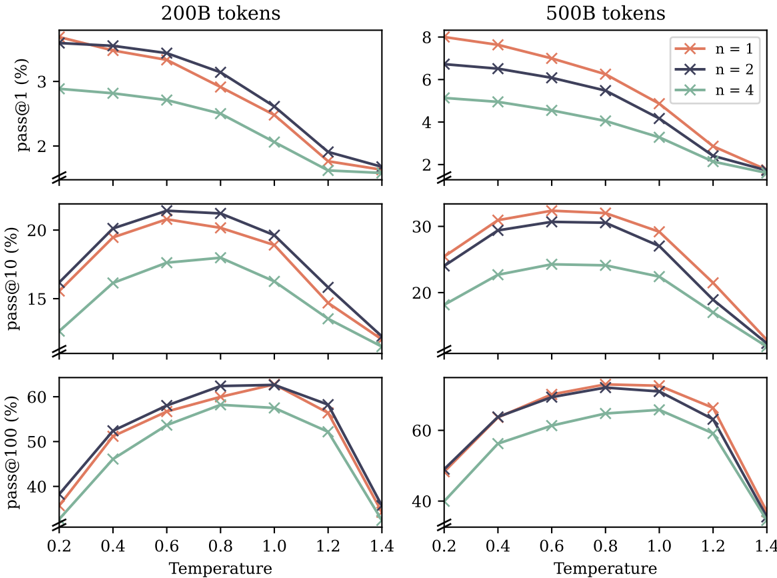
The image contains six line charts arranged in a 3x2 grid. The two columns represent models trained on different amounts of data: **200B tokens** (left column) and **500B tokens** (right column). The three rows represent different performance metrics: **pass@1 (%)**, **pass@10 (%)**, and **pass@100 (%)**. Each chart plots these metrics against **Temperature** (x-axis) for three different sampling settings, labeled `n=1`, `n=2`, and `n=4`.
### Components/Axes
* **X-Axis (All Charts):** Labeled **"Temperature"**. The axis has tick marks at 0.2, 0.4, 0.6, 0.8, 1.0, 1.2, and 1.4.
* **Y-Axes (By Row):**
* **Top Row:** Labeled **"pass@1 (%)"**. Scale ranges approximately from 1.5% to 8%.
* **Middle Row:** Labeled **"pass@10 (%)"**. Scale ranges approximately from 10% to 35%.
* **Bottom Row:** Labeled **"pass@100 (%)"**. Scale ranges approximately from 35% to 70%.
* **Legend:** Located in the **top-right corner of the "500B tokens" column**. It defines three data series:
* `n = 1`: Orange line with 'x' markers.
* `n = 2`: Dark blue/purple line with 'x' markers.
* `n = 4`: Green line with 'x' markers.
* **Chart Titles:** The columns are titled **"200B tokens"** and **"500B tokens"** at the top.
### Detailed Analysis
**Column 1: 200B tokens**
* **Top Chart (pass@1):** All three lines show a **consistent downward trend** as temperature increases. The `n=1` (orange) and `n=2` (blue) lines start highest (~3.5-3.7% at temp=0.2) and decline steadily. The `n=4` (green) line starts lower (~2.9%) and declines more gradually. All lines converge near 1.5-1.8% at temperature 1.4.
* **Middle Chart (pass@10):** All lines show an **inverted U-shape**. Performance increases from temperature 0.2 to a peak around 0.6-0.8, then decreases. The `n=2` (blue) line peaks highest (~21% at temp=0.6), followed closely by `n=1` (orange, ~20.5% at temp=0.6), with `n=4` (green) peaking lower (~18% at temp=0.8). All lines drop to ~12-13% at temperature 1.4.
* **Bottom Chart (pass@100):** All lines show a **pronounced inverted U-shape**. Performance rises sharply to a broad peak between temperatures 0.6 and 1.0, then falls sharply. The `n=2` (blue) and `n=1` (orange) lines are very close, peaking near 62-63%. The `n=4` (green) line peaks lower, around 58%. All lines drop to ~35-38% at temperature 1.4.
**Column 2: 500B tokens**
* **Top Chart (pass@1):** Similar **downward trend** as the 200B model, but with higher absolute values. `n=1` (orange) starts highest (~8% at temp=0.2), followed by `n=2` (blue, ~6.7%), then `n=4` (green, ~5.2%). All decline, converging near 1.8-2.0% at temperature 1.4.
* **Middle Chart (pass@10):** Clear **inverted U-shape**. `n=1` (orange) peaks highest (~33% at temp=0.6-0.8), `n=2` (blue) peaks slightly lower (~31% at temp=0.8), and `n=4` (green) peaks much lower (~25% at temp=0.8-1.0). All decline to ~12-15% at temperature 1.4.
* **Bottom Chart (pass@100):** Strong **inverted U-shape**. `n=1` (orange) and `n=2` (blue) are nearly identical, peaking around 68-70% between temperatures 0.8 and 1.0. `n=4` (green) peaks lower, around 65%. All lines drop steeply to ~38-40% at temperature 1.4.
### Key Observations
1. **Metric-Dependent Trend:** The relationship between temperature and performance changes with the metric. `pass@1` decreases monotonically with temperature, while `pass@10` and `pass@100` show an optimal temperature range (inverted U-shape).
2. **Sampling (`n`) Effect:** For a given temperature and metric, the ordering is consistent: `n=1` (single sample) generally performs best, `n=2` is very close or slightly worse, and `n=4` performs worst. This gap is more pronounced for `pass@10` and in the 500B model.
3. **Model Size Effect:** The model trained on **500B tokens consistently outperforms** the 200B token model across all metrics and temperatures, with the difference being most dramatic for `pass@1` (e.g., ~8% vs ~3.5% at temp=0.2).
4. **High Temperature Degradation:** Performance for all metrics and settings degrades significantly at high temperatures (above 1.0-1.2), often dropping below the performance at the lowest measured temperature (0.2).
5. **Peak Shift:** The optimal temperature for `pass@10` and `pass@100` appears to shift slightly higher (from ~0.6 to ~0.8-1.0) when moving from the 200B to the 500B model.
### Interpretation
This data demonstrates the critical interplay between **model scale, sampling strategy, and decoding temperature** for code generation or similar generative tasks.
* **Temperature as a Trade-off:** Low temperature favors precision and consistency (high `pass@1`), likely by making the model more deterministic. Higher temperatures increase diversity and exploration, which hurts the chance of a single perfect sample (`pass@1` down) but improves the chance that *at least one* good sample exists within multiple attempts (`pass@10` and `pass@100` up to a point). Very high temperatures introduce too much randomness, degrading all metrics.
* **The Value of Scale:** The 500B model's superior performance, especially for the strict `pass@1` metric, indicates that increased training data leads to a more capable and precise base model. This advantage persists across all sampling strategies.
* **Sampling Efficiency:** The finding that `n=1` often outperforms `n=2` and `n=4` at the same temperature is notable. It suggests that for these metrics, simply increasing the number of samples (`n`) without adjusting other parameters (like temperature) is not an efficient strategy and may even be detrimental. The optimal strategy appears to be using a single, well-calibrated sample (`n=1`) at a task-optimal temperature.
* **Practical Implication:** There is no single "best" temperature. The optimal setting depends on the evaluation metric and the model's scale. For applications requiring a single, high-quality output, a lower temperature is better. For applications where multiple attempts are allowed and the goal is to find at least one correct solution, a moderate temperature (around 0.6-1.0) is optimal, with the exact peak depending on model size.