## Line Graphs: Performance Metrics Across Token Counts and Temperature
### Overview
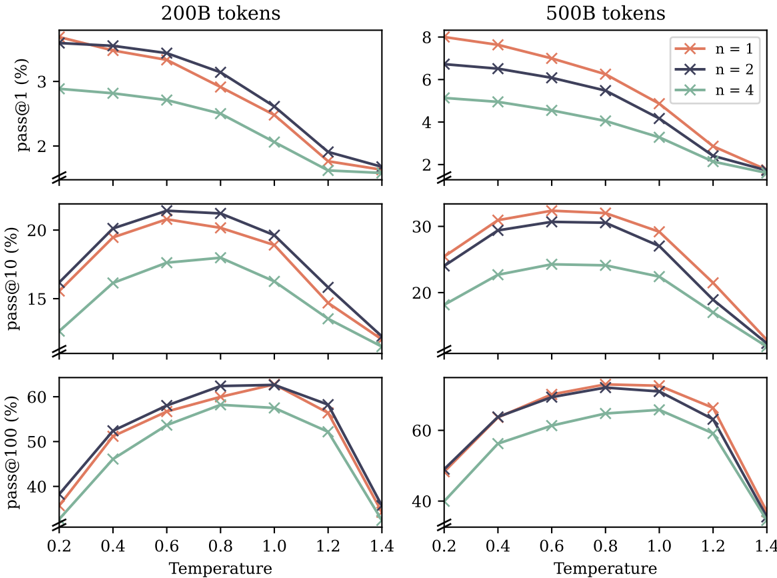
The image contains six line graphs arranged in a 2x3 grid, comparing performance metrics (pass@1 and pass@10) for models with 200B and 500B tokens across varying temperatures (0.2–1.4). Each graph includes three data series representing different sampling strategies (n=1, n=2, n=4), color-coded as red, blue, and green respectively.
### Components/Axes
- **X-axis**: Temperature (0.2–1.4) in increments of 0.2.
- **Y-axis**:
- Top row: pass@1 (%) for 200B and 500B tokens.
- Middle row: pass@10 (%) for 200B and 500B tokens.
- Bottom row: pass@10 (%) for 500B tokens only.
- **Legend**: Located in the top-right corner of each graph, mapping:
- Red: n=1
- Blue: n=2
- Green: n=4
### Detailed Analysis
#### 200B Tokens (Left Column)
1. **pass@1 (%)**:
- **n=1 (Red)**: Starts at ~3.5% (temp=0.2), declines to ~1.2% (temp=1.4).
- **n=2 (Blue)**: Starts at ~3.3%, declines to ~1.0%.
- **n=4 (Green)**: Starts at ~2.8%, declines to ~0.8%.
- **Trend**: All lines slope downward, with n=1 showing the steepest decline.
2. **pass@10 (%)**:
- **n=1 (Red)**: Peaks at ~20% (temp=0.6), drops to ~12% (temp=1.4).
- **n=2 (Blue)**: Peaks at ~22% (temp=0.6), drops to ~10%.
- **n=4 (Green)**: Peaks at ~18% (temp=0.6), drops to ~8%.
#### 500B Tokens (Right Column)
1. **pass@1 (%)**:
- **n=1 (Red)**: Starts at ~8%, declines to ~1.5%.
- **n=2 (Blue)**: Starts at ~6.5%, declines to ~1.2%.
- **n=4 (Green)**: Starts at ~5.5%, declines to ~0.9%.
2. **pass@10 (%)**:
- **n=1 (Red)**: Peaks at ~30% (temp=0.6), drops to ~15%.
- **n=2 (Blue)**: Peaks at ~32% (temp=0.6), drops to ~12%.
- **n=4 (Green)**: Peaks at ~28% (temp=0.6), drops to ~10%.
3. **pass@10 (%) (500B Only)**:
- **n=1 (Red)**: Peaks at ~60% (temp=0.6), drops to ~40%.
- **n=2 (Blue)**: Peaks at ~62% (temp=0.6), drops to ~42%.
- **n=4 (Green)**: Peaks at ~58% (temp=0.6), drops to ~38%.
### Key Observations
1. **Performance Degradation**: All metrics decline as temperature increases, with sharper drops at higher temperatures (e.g., temp=1.4).
2. **Sampling Strategy Impact**: Higher n values (more samples) consistently improve performance:
- n=4 outperforms n=2 and n=1 across all token counts and metrics.
- The gap widens at higher temperatures (e.g., pass@10 for 500B tokens: n=4 at 58% vs. n=1 at 60% at temp=0.6).
3. **Token Count Scaling**: 500B models outperform 200B models by ~2–3× in pass@10 (e.g., 60% vs. 20% at temp=0.6 for pass@10).
### Interpretation
The data demonstrates that:
- **Larger models (500B tokens)** achieve significantly higher performance than smaller models (200B tokens), particularly in pass@10.
- **Sampling diversity (n=4)** mitigates temperature-induced performance drops more effectively than smaller n values.
- **Temperature sensitivity** is non-linear: performance peaks at moderate temperatures (0.6–0.8) before declining sharply at higher temperatures (1.2–1.4).
This suggests that balancing temperature and sampling strategy is critical for optimizing model outputs, with larger models and higher n values providing robustness against temperature-related degradation.