## Bar Chart: Autonomy and Wellbeing Utility Distributions
### Overview
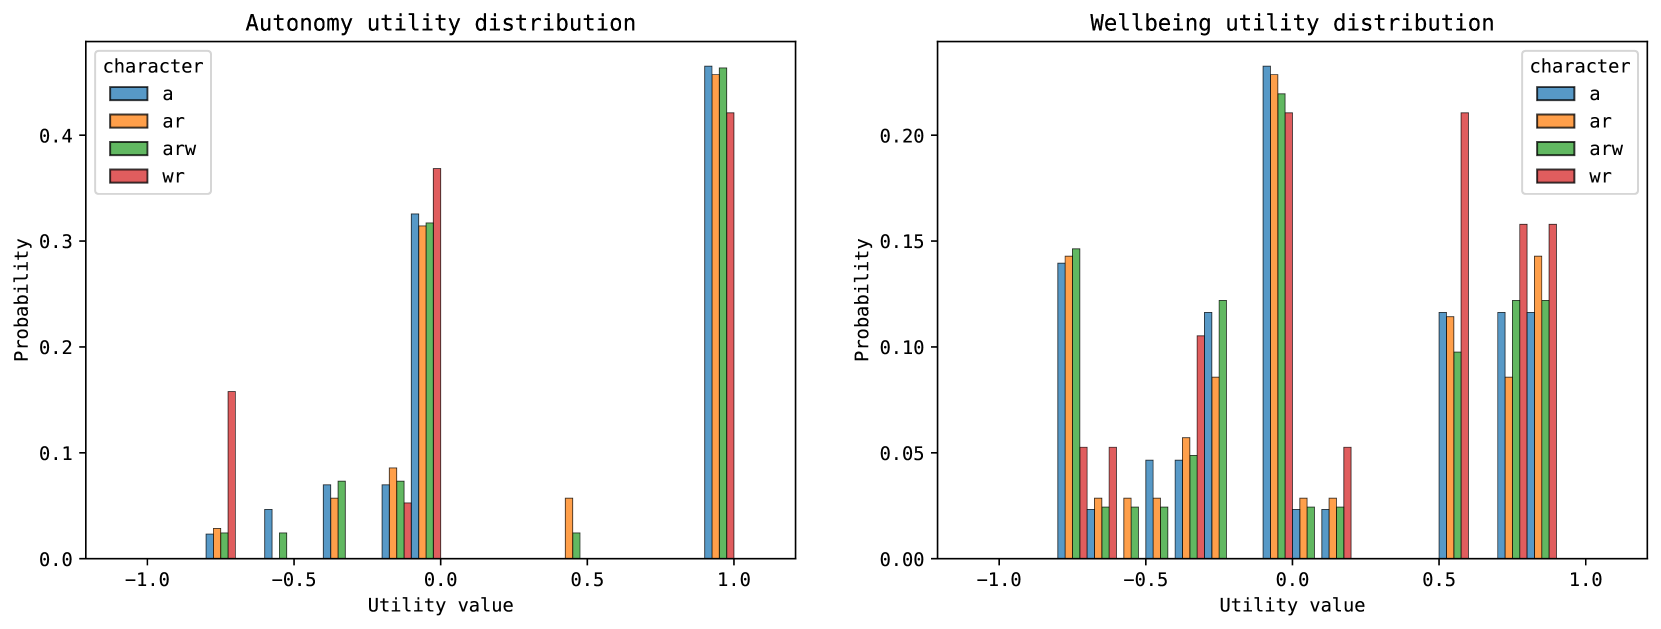
The image presents two bar charts side-by-side, illustrating the utility distributions for autonomy (left) and wellbeing (right) across four characters: 'a', 'ar', 'arw', and 'wr'. The x-axis represents the utility value, ranging from -1.0 to 1.0, while the y-axis represents the probability. Each character is represented by a different color, as indicated in the legend.
### Components/Axes
**Left Chart: Autonomy Utility Distribution**
* **Title:** Autonomy utility distribution
* **X-axis:** Utility value, with markers at -1.0, -0.5, 0.0, 0.5, and 1.0.
* **Y-axis:** Probability, ranging from 0.0 to 0.4, with no explicit markers between.
* **Legend (Top-Left):**
* Blue: a
* Orange: ar
* Green: arw
* Red: wr
**Right Chart: Wellbeing Utility Distribution**
* **Title:** Wellbeing utility distribution
* **X-axis:** Utility value, with markers at -1.0, -0.5, 0.0, 0.5, and 1.0.
* **Y-axis:** Probability, ranging from 0.00 to 0.20, with markers at 0.00, 0.05, 0.10, 0.15, and 0.20.
* **Legend (Top-Right):**
* Blue: a
* Orange: ar
* Green: arw
* Red: wr
### Detailed Analysis
**Autonomy Utility Distribution (Left Chart)**
* **Character 'a' (Blue):**
* At -0.5: Probability ~0.03
* At 0.0: Probability ~0.07
* At 1.0: Probability ~0.45
* **Character 'ar' (Orange):**
* At -0.5: Probability ~0.02
* At 0.0: Probability ~0.08
* At 0.5: Probability ~0.05
* At 1.0: Probability ~0.45
* **Character 'arw' (Green):**
* At -0.5: Probability ~0.07
* At 0.0: Probability ~0.09
* At 1.0: Probability ~0.45
* **Character 'wr' (Red):**
* At -0.75: Probability ~0.08
* At 0.0: Probability ~0.35
* At 1.0: Probability ~0.43
**Wellbeing Utility Distribution (Right Chart)**
* **Character 'a' (Blue):**
* At -1.0: Probability ~0.14
* At -0.5: Probability ~0.05
* At 0.0: Probability ~0.03
* At 0.5: Probability ~0.03
* At 1.0: Probability ~0.12
* **Character 'ar' (Orange):**
* At -1.0: Probability ~0.145
* At -0.5: Probability ~0.03
* At 0.0: Probability ~0.03
* At 0.5: Probability ~0.12
* At 1.0: Probability ~0.16
* **Character 'arw' (Green):**
* At -1.0: Probability ~0.15
* At -0.5: Probability ~0.12
* At 0.0: Probability ~0.03
* At 0.5: Probability ~0.08
* At 1.0: Probability ~0.13
* **Character 'wr' (Red):**
* At -1.0: Probability ~0.05
* At -0.5: Probability ~0.05
* At 0.0: Probability ~0.12
* At 0.5: Probability ~0.16
* At 1.0: Probability ~0.13
### Key Observations
* **Autonomy:** All characters show a high probability (around 0.43-0.45) for a utility value of 1.0, indicating a strong preference for high autonomy. 'wr' also has a significant probability at 0.0.
* **Wellbeing:** The wellbeing utility distributions are more varied. Characters 'a', 'ar', and 'arw' show higher probabilities at -1.0, while 'wr' shows higher probabilities at 0.5.
### Interpretation
The charts suggest that all characters highly value autonomy, as indicated by the high probability at a utility value of 1.0 in the autonomy distribution. However, their preferences for wellbeing are more diverse. Characters 'a', 'ar', and 'arw' may be more sensitive to negative wellbeing impacts, while 'wr' might prioritize other factors over avoiding negative wellbeing. The data could represent different AI agents or user types, each with distinct utility functions that influence their decision-making processes. The differences in wellbeing preferences could lead to different behaviors and choices in scenarios where autonomy and wellbeing are in conflict.