## Bar Charts: Autonomy and Wellbeing Utility Distributions
### Overview
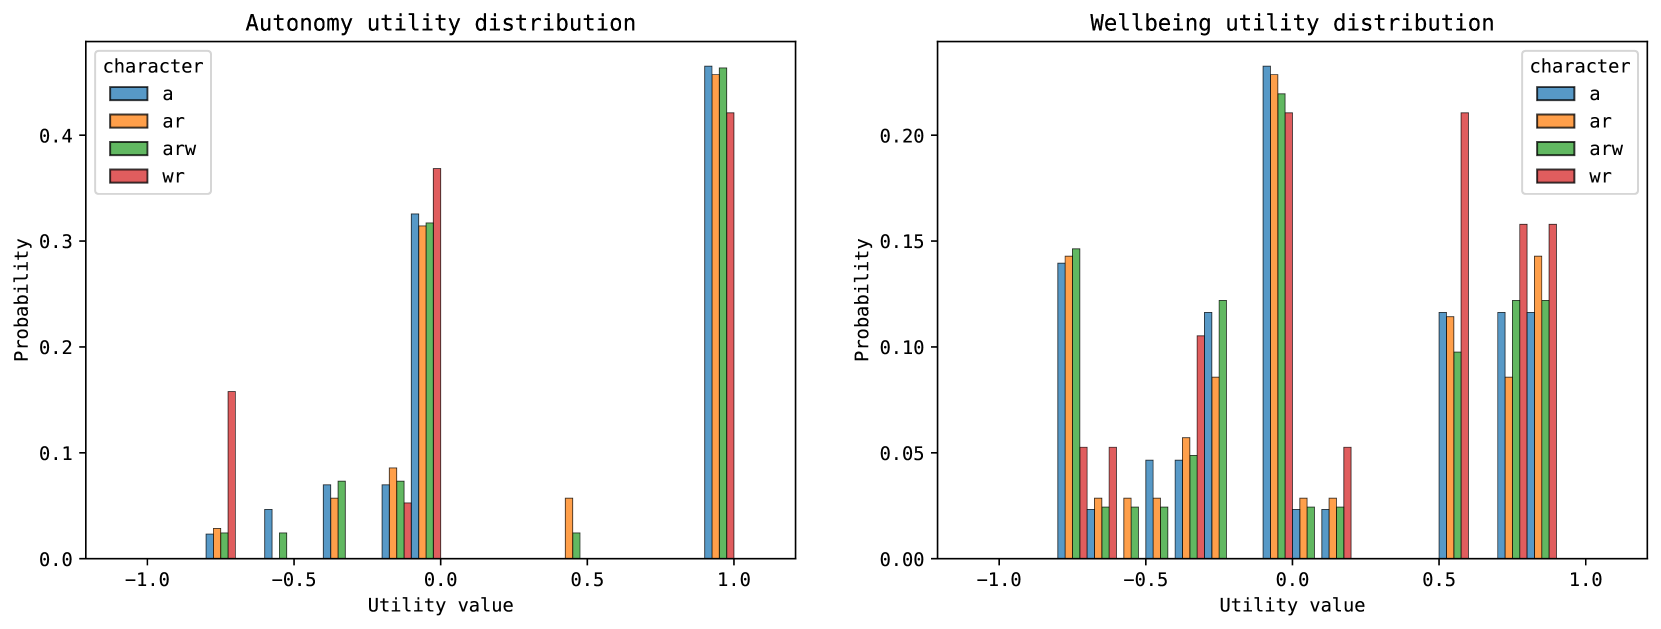
The image displays two side-by-side grouped bar charts illustrating the probability distributions of "utility values" for four distinct characters (labeled 'a', 'ar', 'arw', 'wr'). The left chart represents "Autonomy utility distribution," and the right chart represents "Wellbeing utility distribution." The charts compare how frequently each character achieves specific utility values, ranging from -1.0 to 1.0.
### Components/Axes
* **Common Elements:**
* **Legend:** Located in the top-right corner of both charts.
* **a:** Blue bar
* **ar:** Orange bar
* **arw:** Green bar
* **wr:** Red bar
* **X-axis:** Labeled "Utility value," ranging from -1.0 to 1.0.
* **Y-axis:** Labeled "Probability."
* **Left Chart (Autonomy):**
* Y-axis scale: 0.0 to 0.4+.
* **Right Chart (Wellbeing):**
* Y-axis scale: 0.0 to 0.20+.
---
### Detailed Analysis
#### Left Chart: Autonomy utility distribution
This chart shows a highly polarized distribution, with most probability mass concentrated at the extremes (0.0 and 1.0).
* **Utility ~ -0.75:** Low probability for 'a', 'ar', 'arw' (~0.03). Character 'wr' (red) shows a distinct spike (~0.16).
* **Utility ~ -0.5:** 'a' (blue) is at ~0.05; 'arw' (green) is at ~0.03.
* **Utility ~ -0.3:** 'a', 'ar', and 'arw' show small, similar probabilities (~0.06–0.07).
* **Utility ~ -0.1:** All characters show moderate probability (~0.05–0.09).
* **Utility ~ 0.0:** A major peak for all characters. 'wr' (red) is the highest (~0.37), while 'a', 'ar', and 'arw' are clustered around ~0.32–0.33.
* **Utility ~ 0.4:** 'ar' (orange) shows a small probability (~0.06); 'arw' (green) is lower (~0.03).
* **Utility ~ 1.0:** The highest peak for all characters. 'a', 'ar', and 'arw' are very similar (~0.47), while 'wr' (red) is slightly lower (~0.42).
#### Right Chart: Wellbeing utility distribution
This chart shows a more complex, multimodal distribution with significant probability mass spread across negative and positive values.
* **Utility ~ -0.75:** 'a', 'ar', 'arw' are clustered around ~0.14–0.15. 'wr' (red) is significantly lower (~0.05).
* **Utility ~ -0.6:** 'wr' (red) shows a small spike (~0.05), while others are lower (~0.025).
* **Utility ~ -0.2:** 'wr' (red) is notably higher (~0.11) compared to others (~0.05).
* **Utility ~ -0.1:** 'a' and 'arw' are higher (~0.12), 'ar' and 'wr' are slightly lower (~0.09–0.10).
* **Utility ~ 0.0:** A major peak for all characters, ranging from ~0.21 ('wr') to ~0.23 ('a').
* **Utility ~ 0.5:** 'wr' (red) shows a distinct, high peak (~0.21), significantly higher than 'a', 'ar', and 'arw' (~0.10–0.12).
* **Utility ~ 0.8 to 0.9:** A cluster of activity. 'wr' (red) consistently shows higher probability (~0.16) compared to the others (~0.09–0.14).
---
### Key Observations
* **Polarization vs. Distribution:** Autonomy utility is binary/polarized (mostly 0.0 or 1.0), whereas Wellbeing utility is distributed across a wider spectrum, suggesting that "Wellbeing" is a more nuanced metric in this dataset than "Autonomy."
* **Character 'wr' (Red) Divergence:** In both charts, the 'wr' character consistently behaves differently from the other three.
* In **Autonomy**, 'wr' has a higher probability of being at -0.75 and 0.0, but a lower probability of reaching the 1.0 peak.
* In **Wellbeing**, 'wr' avoids the -0.75 low-utility state but achieves significantly higher probabilities in the 0.5 and 0.8–0.9 utility ranges compared to the other characters.
### Interpretation
The data suggests these charts represent the performance or state-distribution of AI agents (or similar entities) under different reward functions or configurations.
* **Autonomy:** The bimodal distribution at 0.0 and 1.0 suggests a "success or failure" state. Agents either achieve full autonomy (1.0) or remain at a baseline/neutral state (0.0). The 'wr' character appears to be less efficient at reaching the 1.0 state compared to the others.
* **Wellbeing:** The distribution is much more granular. The presence of negative utility values (-0.75) indicates that some states are actively penalized or undesirable. The 'wr' character appears to be optimized differently; it sacrifices the high-probability "neutral" state (0.0) to achieve higher probabilities in the positive utility range (0.5–0.9), suggesting 'wr' might be a "risk-taking" or "high-reward" configuration compared to the others.