\n
## Histograms: Utility Distributions for Autonomy and Wellbeing
### Overview
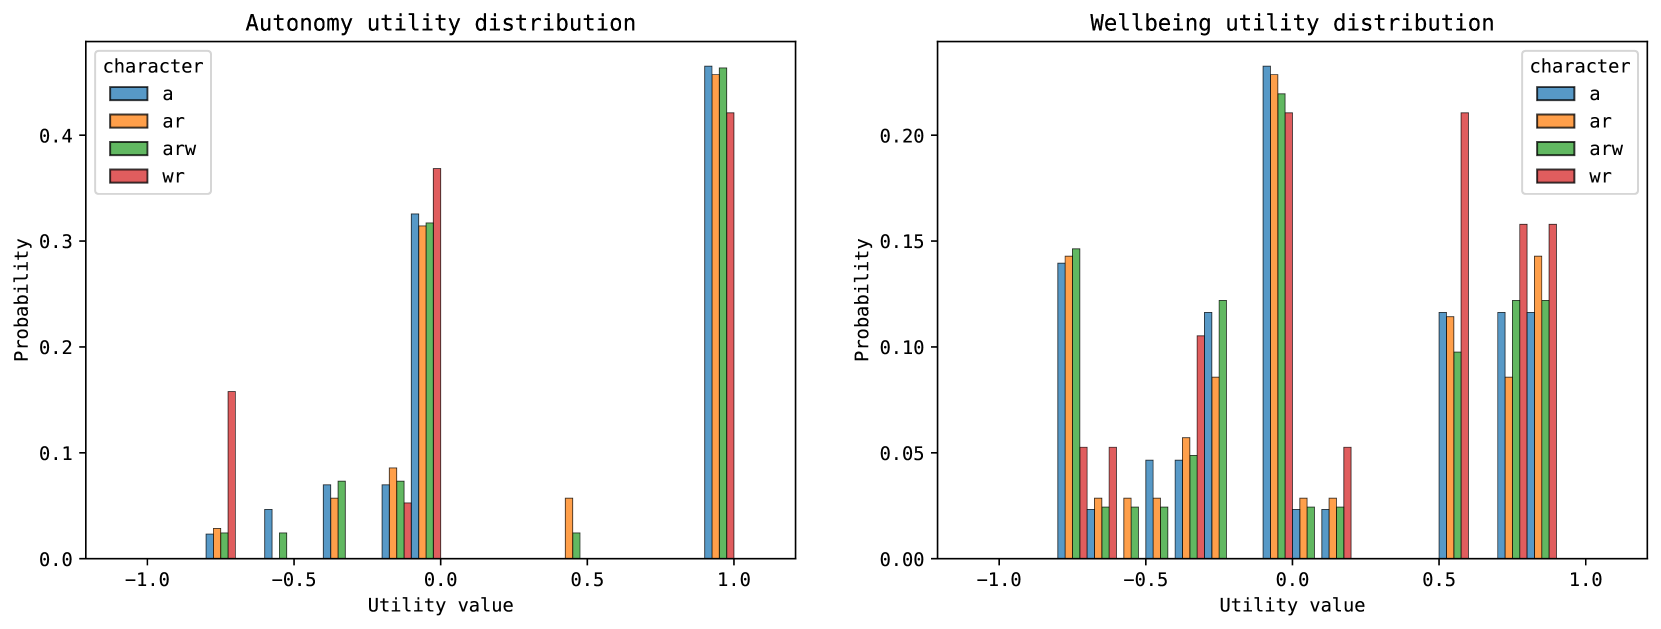
The image presents two histograms displayed side-by-side. The left histogram shows the distribution of "Utility value" for "Autonomy", while the right histogram shows the distribution of "Utility value" for "Wellbeing". Both histograms display data for four different "character" types: 'a', 'ar', 'arw', and 'wr'. The y-axis in both charts represents "Probability", and the x-axis represents "Utility value", ranging from -1.0 to 1.0.
### Components/Axes
* **Title (Left):** "Autonomy utility distribution"
* **Title (Right):** "Wellbeing utility distribution"
* **X-axis Label (Both):** "Utility value" (Scale: -1.0 to 1.0)
* **Y-axis Label (Both):** "Probability" (Scale: 0.0 to 0.4)
* **Legend (Both, Top-Left):**
* 'a' (Blue)
* 'ar' (Orange)
* 'arw' (Green)
* 'wr' (Red)
### Detailed Analysis or Content Details
**Left Histogram (Autonomy):**
* **'a' (Blue):** The distribution is concentrated around a Utility value of -0.5, with a peak probability of approximately 0.08. There's a slight tail extending towards negative Utility values.
* **'ar' (Orange):** The distribution is centered around a Utility value of 0.0, with a peak probability of approximately 0.12. It's relatively narrow.
* **'arw' (Green):** This distribution shows a strong peak at a Utility value of approximately 0.8, with a peak probability of around 0.38. It's the most prominent distribution in this chart.
* **'wr' (Red):** The distribution is centered around a Utility value of 0.8, with a peak probability of approximately 0.35. It's also a prominent distribution, similar to 'arw'.
**Right Histogram (Wellbeing):**
* **'a' (Blue):** The distribution is centered around a Utility value of 0.5, with a peak probability of approximately 0.25.
* **'ar' (Orange):** The distribution is centered around a Utility value of -0.5, with a peak probability of approximately 0.06.
* **'arw' (Green):** The distribution is centered around a Utility value of 0.5, with a peak probability of approximately 0.16.
* **'wr' (Red):** The distribution is centered around a Utility value of 0.8, with a peak probability of approximately 0.18.
### Key Observations
* For Autonomy, 'arw' and 'wr' characters exhibit significantly higher Utility values compared to 'a' and 'ar'.
* For Wellbeing, 'a' and 'wr' characters exhibit higher Utility values compared to 'ar' and 'arw'.
* The 'ar' character consistently shows lower Utility values across both Autonomy and Wellbeing.
* The 'arw' character has the highest Utility value for Autonomy, while the 'a' character has the highest Utility value for Wellbeing.
### Interpretation
The data suggests a trade-off between Autonomy and Wellbeing across the different character types. Characters with high Autonomy ('arw' and 'wr') tend to have lower Wellbeing, and vice versa ('a'). The 'ar' character consistently demonstrates low Utility values for both Autonomy and Wellbeing, potentially indicating a disadvantageous state.
The distributions reveal how the Utility values are spread for each character type. The narrow distributions for 'ar' suggest a more consistent, albeit low, level of Autonomy and Wellbeing. The broader distributions for other characters indicate greater variability in their experiences.
The peaks in the histograms represent the most probable Utility values for each character type. The differences in peak locations and shapes highlight the distinct patterns of Autonomy and Wellbeing across the characters. The data could be used to understand the characteristics of each character and how they relate to these two key dimensions.