## Bar Charts: Autonomy and Wellbeing Utility Distributions
### Overview
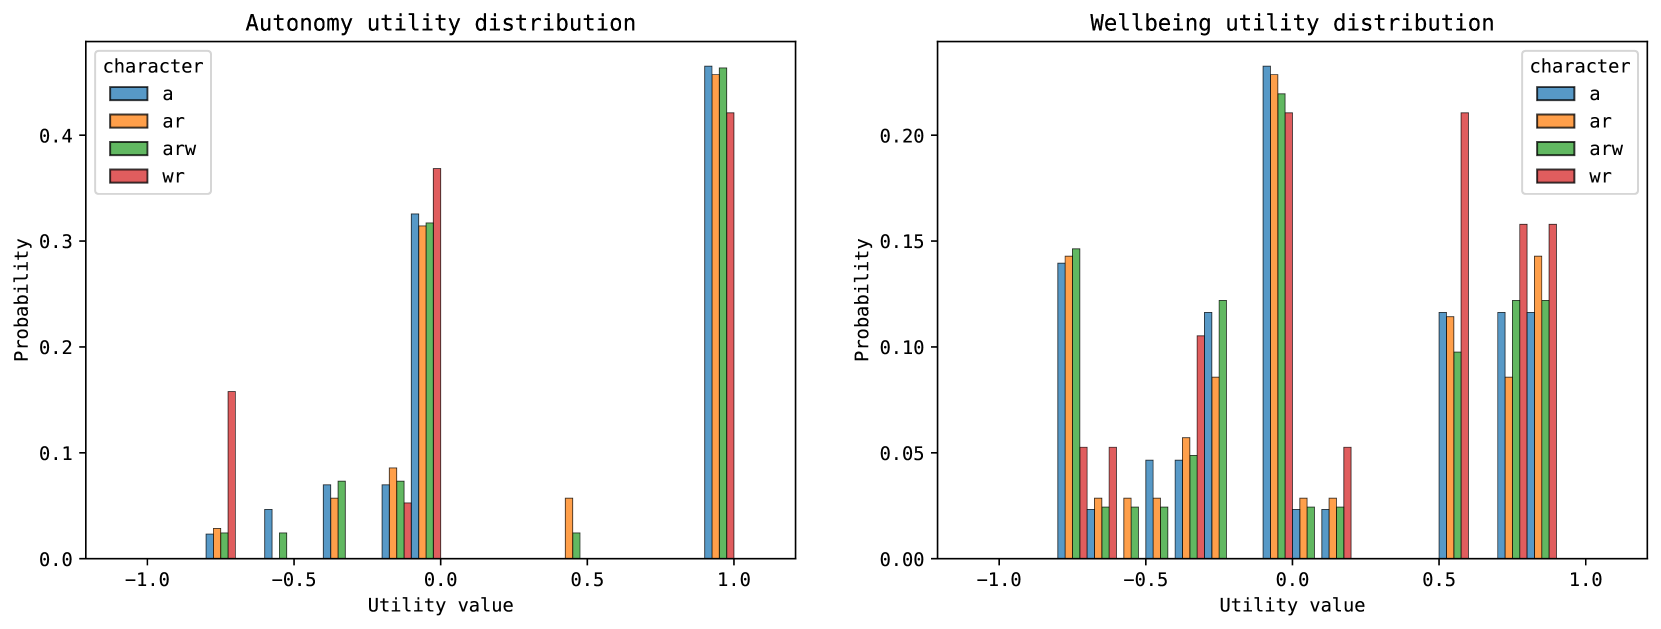
The image contains two side-by-side bar charts comparing utility distributions for four characters (a, ar, arw, wr) across two metrics: autonomy and wellbeing. Each chart uses grouped bars to represent probability distributions across utility values ranging from -1.0 to 1.0.
### Components/Axes
- **X-axis**: Utility value (continuous scale from -1.0 to 1.0 in 0.5 increments)
- **Y-axis (left chart)**: Probability (0.0 to 0.4 in 0.1 increments)
- **Y-axis (right chart)**: Probability (0.0 to 0.2 in 0.05 increments)
- **Legend**: Located left of each chart, mapping colors to characters:
- Blue = a
- Orange = ar
- Green = arw
- Red = wr
- **Chart Titles**:
- Left: "Autonomy utility distribution"
- Right: "Wellbeing utility distribution"
### Detailed Analysis
#### Autonomy Utility Distribution
- **arw (green)**: Highest probability (~0.4) at utility value 1.0
- **wr (red)**: Peak at 0.0 (~0.35 probability)
- **a (blue)**: Moderate peak at 0.0 (~0.3 probability)
- **ar (orange)**: Distributed across 0.0 and 1.0 (~0.3 combined)
- **Notable**: arw dominates at maximum utility; wr shows bimodal distribution
#### Wellbeing Utility Distribution
- **ar (orange)**: Highest probability (~0.25) at utility value 0.0
- **wr (red)**: Peak at 0.5 (~0.2 probability)
- **a (blue)**: Distributed across -0.5, 0.0, and 0.5 (~0.15 combined)
- **arw (green)**: Bimodal distribution with peaks at 0.0 and 0.5 (~0.18 combined)
- **Notable**: ar dominates at neutral utility; wr shows strong preference at 0.5
### Key Observations
1. **Autonomy**: arw character exhibits strongest preference for maximum utility (1.0)
2. **Wellbeing**: ar character shows highest utility at neutral value (0.0)
3. **wr character**: Demonstrates distinct bimodal distributions in both metrics
4. **a character**: Shows moderate but consistent presence across utility values
5. **arw character**: Exhibits highest variance in autonomy distribution
### Interpretation
The data suggests fundamental differences in how characters prioritize autonomy vs. wellbeing:
- **arw's** dominance in autonomy at maximum utility implies a strong preference for self-determination when resources are abundant
- **ar's** neutral utility peak in wellbeing suggests balanced satisfaction at baseline conditions
- **wr's** bimodal patterns indicate polarized preferences - either strong aversion to negative utility or high valuation of moderate positive utility
- The **a character's** distributed pattern may reflect adaptive behavior across different utility contexts
These distributions could represent behavioral tendencies in decision-making models, where characters exhibit distinct utility optimization strategies. The wellbeing distribution's concentration at neutral values might indicate homeostasis-seeking behavior, while the autonomy distribution's right-skew suggests proactive resource acquisition tendencies.