## Line Chart: ΔP vs. Layer for Qwen Models
### Overview
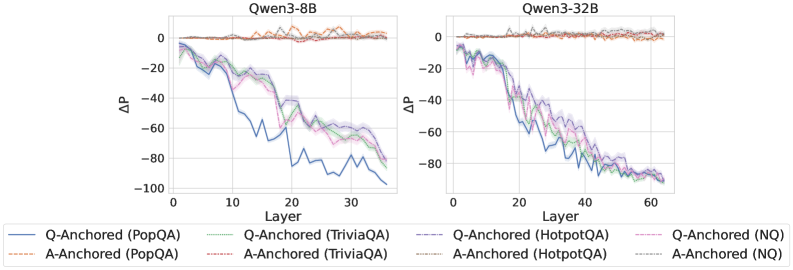
The image presents two line charts comparing the change in performance (ΔP) across different layers for two Qwen language models: Qwen3-8B and Qwen3-32B. The charts display ΔP as a function of layer number, with different lines representing different question-answering datasets (PopQA, TriviaQA, HotpotQA, and NQ) and anchoring methods (Q-Anchored and A-Anchored).
### Components/Axes
* **X-axis:** Layer (ranging from approximately 0 to 35 for Qwen3-8B and 0 to 60 for Qwen3-32B).
* **Y-axis:** ΔP (ranging from approximately -100 to 0).
* **Models:** Qwen3-8B (left chart), Qwen3-32B (right chart).
* **Datasets/Anchoring:**
* PopQA (Q-Anchored - Blue solid line, A-Anchored - Brown dashed-dotted line)
* TriviaQA (Q-Anchored - Purple solid line, A-Anchored - Orange dashed-dotted line)
* HotpotQA (Q-Anchored - Green dashed line, A-Anchored - Pink solid line)
* NQ (Q-Anchored - Teal dashed line, A-Anchored - Magenta solid line)
* **Legend:** Located at the bottom of the image, clearly associating colors with datasets and anchoring methods.
### Detailed Analysis
**Qwen3-8B (Left Chart):**
* **Q-Anchored (PopQA) - Blue Solid Line:** Starts around ΔP = -5, decreases steadily to approximately -85 by layer 35.
* **A-Anchored (PopQA) - Brown Dashed-Dotted Line:** Remains relatively stable around ΔP = -2 to -5 across all layers.
* **Q-Anchored (TriviaQA) - Purple Solid Line:** Starts around ΔP = -15, decreases to approximately -70 by layer 35.
* **A-Anchored (TriviaQA) - Orange Dashed-Dotted Line:** Similar to PopQA A-Anchored, remains relatively stable around ΔP = -5 to -10.
* **Q-Anchored (HotpotQA) - Green Dashed Line:** Starts around ΔP = -20, decreases to approximately -60 by layer 35.
* **A-Anchored (HotpotQA) - Pink Solid Line:** Starts around ΔP = -10, decreases to approximately -50 by layer 35.
* **Q-Anchored (NQ) - Teal Dashed Line:** Starts around ΔP = -25, decreases to approximately -80 by layer 35.
* **A-Anchored (NQ) - Magenta Solid Line:** Starts around ΔP = -15, decreases to approximately -60 by layer 35.
**Qwen3-32B (Right Chart):**
* **Q-Anchored (PopQA) - Blue Solid Line:** Starts around ΔP = -5, decreases steadily to approximately -90 by layer 60.
* **A-Anchored (PopQA) - Brown Dashed-Dotted Line:** Remains relatively stable around ΔP = -2 to -5 across all layers.
* **Q-Anchored (TriviaQA) - Purple Solid Line:** Starts around ΔP = -15, decreases to approximately -75 by layer 60.
* **A-Anchored (TriviaQA) - Orange Dashed-Dotted Line:** Similar to PopQA A-Anchored, remains relatively stable around ΔP = -5 to -10.
* **Q-Anchored (HotpotQA) - Green Dashed Line:** Starts around ΔP = -20, decreases to approximately -65 by layer 60.
* **A-Anchored (HotpotQA) - Pink Solid Line:** Starts around ΔP = -10, decreases to approximately -55 by layer 60.
* **Q-Anchored (NQ) - Teal Dashed Line:** Starts around ΔP = -25, decreases to approximately -85 by layer 60.
* **A-Anchored (NQ) - Magenta Solid Line:** Starts around ΔP = -15, decreases to approximately -65 by layer 60.
### Key Observations
* **General Trend:** For both models, Q-Anchored lines consistently show a decreasing trend in ΔP as the layer number increases, indicating a performance degradation with depth.
* **A-Anchored Stability:** A-Anchored lines remain relatively stable across all layers, suggesting that performance is less affected by depth when using this anchoring method.
* **Dataset Variation:** The magnitude of ΔP varies depending on the dataset. PopQA and NQ generally exhibit larger decreases in ΔP for Q-Anchored lines compared to TriviaQA and HotpotQA.
* **Model Size Impact:** The Qwen3-32B model shows a more pronounced decrease in ΔP for Q-Anchored lines compared to the Qwen3-8B model, suggesting that the performance degradation with depth is more significant in larger models.
### Interpretation
The charts demonstrate the impact of model depth on performance for different question-answering datasets and anchoring methods. The consistent decline in ΔP for Q-Anchored lines suggests that deeper layers may introduce noise or hinder the model's ability to effectively process information for these datasets. The stability of A-Anchored lines indicates that this anchoring method may mitigate the negative effects of depth.
The differences in ΔP across datasets suggest that the optimal model depth may vary depending on the specific task. The more pronounced performance degradation in the larger Qwen3-32B model highlights the challenges of scaling deep learning models and the need for techniques to maintain performance as models grow in size.
The data suggests that A-Anchoring is a more robust method for maintaining performance across layers, while Q-Anchoring suffers from performance degradation as the model gets deeper. This could be due to the way information is processed or the types of features learned in deeper layers. Further investigation is needed to understand the underlying mechanisms driving these trends.