## Line Chart: ΔP Values Across Layers for Qwen3-8B and Qwen3-32B Models
### Overview
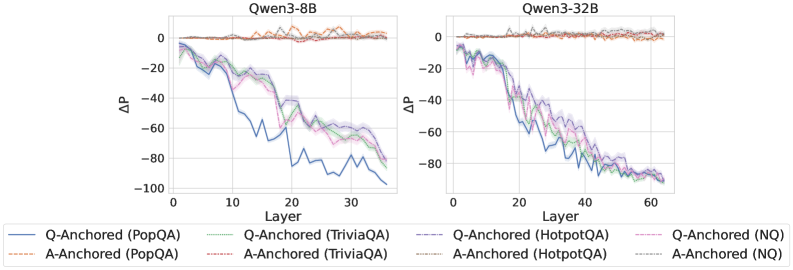
The image contains two side-by-side line charts comparing the ΔP (change in performance) values across layers for two model sizes: Qwen3-8B (left) and Qwen3-32B (right). Each chart tracks six distinct methods (Q-Anchored and A-Anchored variants across four datasets: PopQA, TriviaQA, HotpotQA, and NQ) as they progress through model layers. The charts use color-coded lines with distinct styles to differentiate methods.
### Components/Axes
- **X-axis**: "Layer" (0 to 30 for Qwen3-8B, 0 to 60 for Qwen3-32B)
- **Y-axis**: "ΔP" (ranging from -100 to 0)
- **Legends**:
- **Qwen3-8B**:
- Blue solid: Q-Anchored (PopQA)
- Orange dashed: A-Anchored (PopQA)
- Green dash-dot: Q-Anchored (TriviaQA)
- Red dotted: A-Anchored (TriviaQA)
- Purple solid: Q-Anchored (HotpotQA)
- Pink dashed: A-Anchored (HotpotQA)
- Gray dash-dot: Q-Anchored (NQ)
- Brown dotted: A-Anchored (NQ)
- **Qwen3-32B**:
- Same legend structure as Qwen3-8B but with adjusted line trends.
### Detailed Analysis
#### Qwen3-8B Chart
- **Q-Anchored (PopQA)** (blue solid): Starts near 0, drops sharply to ~-100 by layer 30, with oscillations.
- **A-Anchored (PopQA)** (orange dashed): Remains near 0 with minor fluctuations.
- **Q-Anchored (TriviaQA)** (green dash-dot): Gradual decline from 0 to ~-60, with volatility.
- **A-Anchored (TriviaQA)** (red dotted): Stable near 0.
- **Q-Anchored (HotpotQA)** (purple solid): Sharp drop to ~-80 by layer 20, then stabilizes.
- **A-Anchored (HotpotQA)** (pink dashed): Slight decline to ~-20, then stabilizes.
- **Q-Anchored (NQ)** (gray dash-dot): Oscillates between -20 and 0.
- **A-Anchored (NQ)** (brown dotted): Stable near 0.
#### Qwen3-32B Chart
- **Q-Anchored (PopQA)** (blue solid): Starts near 0, declines to ~-80 by layer 60, with oscillations.
- **A-Anchored (PopQA)** (orange dashed): Stable near 0.
- **Q-Anchored (TriviaQA)** (green dash-dot): Gradual decline to ~-60, with volatility.
- **A-Anchored (TriviaQA)** (red dotted): Stable near 0.
- **Q-Anchored (HotpotQA)** (purple solid): Sharp drop to ~-80 by layer 20, then stabilizes.
- **A-Anchored (HotpotQA)** (pink dashed): Slight decline to ~-20, then stabilizes.
- **Q-Anchored (NQ)** (gray dash-dot): Steady decline from 0 to ~-60.
- **A-Anchored (NQ)** (brown dotted): Stable near 0.
### Key Observations
1. **Model Size Impact**: Qwen3-32B shows more pronounced ΔP declines for Q-Anchored methods compared to Qwen3-8B.
2. **Dataset Sensitivity**:
- PopQA and HotpotQA datasets exhibit the largest ΔP drops for Q-Anchored methods.
- NQ dataset shows the most stable trends for A-Anchored methods.
3. **Anchoring Effect**: A-Anchored methods (dashed lines) generally maintain higher ΔP values (closer to 0) than Q-Anchored methods (solid lines).
4. **Layer Progression**: ΔP trends become more stable in deeper layers (layers >20) for both models.
### Interpretation
The data suggests that anchoring methods (Q-Anchored vs. A-Anchored) significantly influence ΔP values, with Q-Anchored methods showing greater performance degradation across layers. Larger models (Qwen3-32B) exhibit more severe ΔP declines for Q-Anchored methods, potentially indicating scalability challenges. The NQ dataset's unique trend (steady decline in Q-Anchored methods) may reflect dataset-specific characteristics or methodological differences. A-Anchored methods appear more robust, maintaining stability across layers and model sizes. These findings highlight the importance of anchoring strategy selection based on model architecture and task requirements.