TECHNICAL ASSET FINGERPRINT
83c75b3a262ec424a35a6ca6
Click to view fullscreen
Press ESC or click to close
FOUND IN PAPERS
EXPERT: healer-alpha-free VERSION 1
RUNTIME: free/openrouter/healer-alpha
INTEL_VERIFIED
## Diagram: Conceptual Model of Letter Relationships and Transformations
### Overview
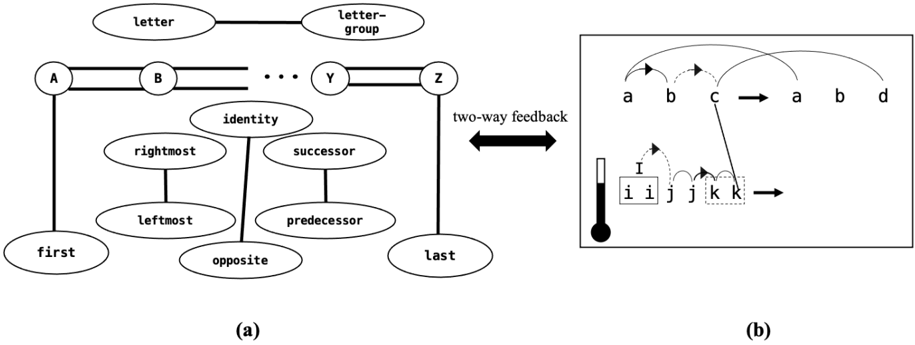
The image contains two distinct but related diagrams, labeled (a) and (b), presented side-by-side. Diagram (a) is a hierarchical concept map defining relationships within a sequence of letters. Diagram (b) is a process or transformation diagram showing operations on sequences of letters, with a visual metaphor involving a thermometer. A thick, double-headed arrow labeled "two-way feedback" connects the two diagrams, indicating a reciprocal relationship between the conceptual model and the transformation process.
### Components/Axes
**Diagram (a) - Left Side:**
* **Primary Structure:** A horizontal sequence of circles labeled `A`, `B`, `...`, `Y`, `Z`, connected by double lines. This represents an ordered set or alphabet.
* **Top-Level Concepts:** Two ovals above the sequence: `letter` (connected to `A`) and `letter-group` (connected to `Z`).
* **Relational Concepts:** A network of ovals below the sequence, connected by solid lines indicating relationships:
* `first` (connected to `A`)
* `last` (connected to `Z`)
* `identity` (central node)
* `opposite` (connected to `identity`)
* `rightmost` and `leftmost` (connected to each other)
* `successor` and `predecessor` (connected to each other)
* **Connection Label:** The double line between `Y` and `Z` is labeled `two-way feedback` with a large arrow pointing to diagram (b).
**Diagram (b) - Right Side:**
* **Transformation Sequence (Top):** A sequence of letters `a`, `b`, `c` with curved arrows above them pointing from `a` to `b` and from `b` to `c`. A straight arrow points from `c` to a new sequence: `a`, `b`, `d`.
* **Transformation Sequence (Bottom):** A sequence of letters `i`, `i`, `j`, `j`, `k`, `k`. The first `i` and the second `k` are enclosed in dotted-line boxes. Curved arrows connect the first `i` to the second `i`, the first `j` to the second `j`, and the first `k` to the second `k`. A straight arrow points from this sequence to the right (destination not shown).
* **Thermometer Icon:** A vertical thermometer icon is positioned to the left of the bottom sequence (`i i j j k k`). The mercury level is approximately 75% full.
### Detailed Analysis
**Diagram (a) Content Details:**
This diagram models a letter-based system with the following defined entities and relationships:
1. **Core Sequence:** An ordered list from `A` to `Z`.
2. **Cardinality:** The sequence has defined endpoints: `first` (A) and `last` (Z).
3. **Positional Relationships:** Concepts like `leftmost`, `rightmost`, `successor`, and `predecessor` define relative positioning within the sequence.
4. **Abstract Relationships:** `identity` and `opposite` suggest higher-order logical or functional relationships between elements.
5. **Hierarchy:** The system distinguishes between an individual `letter` and a `letter-group`.
**Diagram (b) Content Details:**
This diagram illustrates two potential transformation rules or processes:
1. **Top Transformation:** A sequence `a, b, c` is transformed into `a, b, d`. The curved arrows suggest a dependency or operation flowing from left to right (`a` influences `b`, which influences `c`), culminating in a change where the final element `c` becomes `d`.
2. **Bottom Transformation:** A sequence of doubled letters `i, i, j, j, k, k` is shown. The dotted boxes around the first `i` and the second `k` may indicate these are special elements (e.g., start/end markers, or elements undergoing a specific operation). The curved arrows between identical letters suggest a pairing or matching operation. The thermometer icon, with its high reading, likely symbolizes a measure of "intensity," "temperature," "load," or "activation level" associated with this process.
### Key Observations
1. **Structural Contrast:** Diagram (a) is a static, hierarchical knowledge representation. Diagram (b) is a dynamic, procedural flowchart.
2. **Symbolic Language:** Both diagrams use a minimal symbolic language (letters, arrows, basic shapes) to convey abstract concepts.
3. **The Thermometer:** This is a unique, non-textual element in diagram (b). Its high level is a key data point, suggesting the process it accompanies is in a high state of some measured variable.
4. **Feedback Loop:** The explicit "two-way feedback" link is critical. It implies the conceptual model in (a) informs the processes in (b), and the outcomes of (b) can refine or alter the model in (a).
5. **Transformation Specificity:** The top transformation in (b) changes the last element (`c` -> `d`). The bottom transformation focuses on pairs of identical elements, with specific start (`i`) and end (`k`) points highlighted.
### Interpretation
This image appears to describe a **cognitive or computational system for manipulating symbolic sequences**, likely in the context of linguistics, formal grammar, or algorithm design.
* **What the data suggests:** Diagram (a) establishes the "ontology" or foundational rules of the system—what the elements are and how they relate. Diagram (b) shows "operations" or "processes" that act upon sequences built from that ontology. The feedback loop suggests an adaptive or learning system where practice (b) informs theory (a).
* **How elements relate:** The relational concepts in (a) like `successor` and `predecessor` are likely the rules applied in the transformations shown in (b). For example, changing `c` to `d` in the top sequence of (b) might involve applying a `successor` operation. The paired letters in the bottom sequence of (b) might be testing `identity` relationships.
* **Notable anomalies/inferences:** The thermometer is the most significant anomaly. It introduces a continuous, analog measure into an otherwise discrete, symbolic system. This could represent:
* **Cognitive Load:** The mental effort required to process the sequence `i i j j k k`.
* **System Activation:** The "heat" or activity level in a neural network processing these patterns.
* **Confidence Score:** A measure of certainty in the transformation being applied.
* **Temporal Pressure:** A "time pressure" indicator for completing the operation.
In essence, the image models a closed-loop system where abstract knowledge about sequences governs concrete operations on those sequences, and the performance or state of those operations (measured by the "thermometer") feeds back to update the abstract knowledge. This is a common framework in fields like machine learning, cognitive science, and adaptive systems.
DECODING INTELLIGENCE...