## Diagram: Hierarchical Structure and Process Flow
### Overview
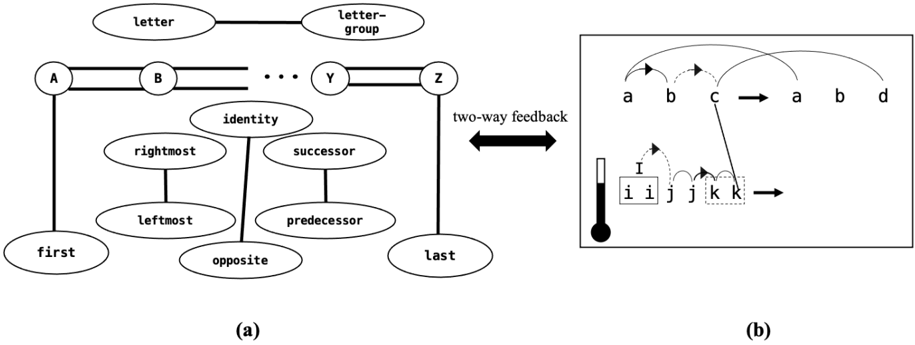
The image consists of two interconnected diagrams:
1. **Hierarchical Diagram (a)**: A structured network of nodes representing relationships between letters (A-Z) and their attributes.
2. **Flowchart (b)**: A process flow with letters (a-d), a thermometer, and directional arrows indicating transitions.
---
### Components/Axes
#### Hierarchical Diagram (a):
- **Top Level**:
- "letter" (oval) → "letter-group" (oval)
- **Horizontal Line**:
- Nodes labeled A, B, ..., Y, Z (circular) connected sequentially.
- **Sub-Nodes**:
- Each node (A-Z) has sub-nodes:
- **identity** (central)
- **rightmost** → **first**
- **leftmost** → **last**
- **successor** → **last**
- **predecessor** → **first**
- **opposite** → **first**
- **Feedback**:
- Two-way arrow between the horizontal line (A-Z) and sub-nodes (identity, rightmost, etc.).
#### Flowchart (b):
- **Letters**:
- a → b → c → d (solid arrows).
- Dotted arrows:
- a → b (dashed)
- c → a (dashed)
- **Thermometer**:
- Vertical scale labeled "i" (0–100).
- Dotted line from "j" to "k" (dashed).
---
### Detailed Analysis
#### Hierarchical Diagram (a):
- **Key Relationships**:
- **identity** acts as a central hub connecting to positional attributes (rightmost, leftmost) and relational attributes (successor, predecessor, opposite).
- **rightmost** and **leftmost** directly link to **first** and **last**, respectively.
- **successor** and **predecessor** create cyclical dependencies (e.g., successor → last, predecessor → first).
- **Feedback Loop**:
- The two-way arrow suggests dynamic interaction between the linear sequence (A-Z) and its attributes.
#### Flowchart (b):
- **Process Flow**:
- Primary path: a → b → c → d.
- Secondary paths:
- a → b (dashed)
- c → a (dashed), forming a loop.
- **Thermometer**:
- Scale labeled "i" (0–100) implies a measurable parameter influencing the process.
- Dotted line from "j" to "k" suggests an optional or conditional step.
---
### Key Observations
1. **Hierarchical Structure**:
- The A-Z sequence is modular, with each node having multiple relational roles (e.g., A is both a node and a "first" in some contexts).
- Attributes like "opposite" and "successor" imply bidirectional or cyclical relationships.
2. **Flowchart Dynamics**:
- The loop (c → a) indicates a recurring or iterative process.
- The thermometer ("i") may represent a threshold or status affecting transitions (e.g., "j" to "k" only occurs if "i" meets a condition).
---
### Interpretation
- **System Design**:
- The hierarchical diagram likely models a structured system (e.g., a sequence of elements with positional and relational metadata).
- The flowchart represents a process flow within this system, where feedback loops and conditional steps (e.g., thermometer "i") regulate transitions.
- **Critical Insights**:
- The two-way feedback in (a) suggests the system adapts based on its attributes (e.g., "rightmost" influencing the sequence).
- The thermometer in (b) could act as a control mechanism, with "i" determining whether the process proceeds linearly or loops back.
- **Anomalies**:
- The dotted line from "j" to "k" lacks explicit conditions, leaving its role ambiguous.
- The loop (c → a) might indicate a failure state or a deliberate cyclical operation.
This diagram illustrates a dynamic system where hierarchical relationships and process flows interact through feedback and conditional logic.