# Technical Document Extraction: Pipeline Execution Diagram
## 1. Overview
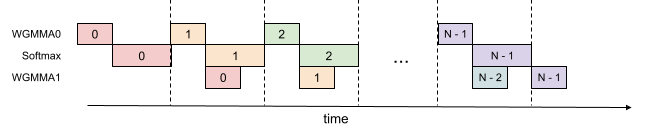
This image is a technical timing diagram illustrating a pipelined execution flow of three distinct computational tasks over time. The diagram uses a horizontal axis to represent time and a vertical axis to categorize the types of operations. It demonstrates a multi-stage pipeline where different operations (WGMMA0, Softmax, and WGMMA1) are interleaved to maximize hardware utilization.
## 2. Component Isolation
### 2.1 Axis and Labels
* **X-Axis:** A horizontal arrow pointing to the right, labeled **"time"** at the bottom center.
* **Y-Axis Labels:** Three categories are listed on the left side:
1. **WGMMA0** (Top row)
2. **Softmax** (Middle row)
3. **WGMMA1** (Bottom row)
* **Temporal Markers:** Vertical dashed lines divide the timeline into discrete execution stages or cycles.
### 2.2 Data Series (Operations)
The diagram uses color-coded blocks to represent specific iterations of a task. Each block contains a numerical identifier (0, 1, 2, ..., N-2, N-1).
| Color | Iteration Index | Description |
| :--- | :--- | :--- |
| **Light Red/Pink** | 0 | The first set of operations in the pipeline. |
| **Light Orange** | 1 | The second set of operations. |
| **Light Green** | 2 | The third set of operations. |
| **Light Purple** | N-1 | The final set of operations in the sequence. |
| **Light Blue** | N-2 | The penultimate operation for WGMMA1. |
---
## 3. Execution Flow and Logic
### 3.1 Sequential Dependency (Intra-iteration)
For any single iteration index (e.g., "0"), the tasks follow a staggered downward staircase pattern:
1. **WGMMA0** starts first.
2. **Softmax** starts immediately after WGMMA0 finishes.
3. **WGMMA1** starts immediately after Softmax finishes.
### 3.2 Pipelining Trend (Inter-iteration)
The diagram shows that while one iteration is performing a later stage, the next iteration begins its early stage.
* **Trend Observation:** The blocks slope downward and to the right for a single index, but the start of a new index (e.g., Index 1) aligns vertically with the start of the Softmax stage of the previous index (Index 0).
---
## 4. Detailed Step-by-Step Pipeline Transcription
| Time Interval (Defined by Dashed Lines) | WGMMA0 (Top) | Softmax (Middle) | WGMMA1 (Bottom) |
| :--- | :--- | :--- | :--- |
| **Interval 1** | Task 0 | (Idle) | (Idle) |
| **Interval 2** | (Idle) | Task 0 | (Idle) |
| **Interval 3** | Task 1 | Task 1 (Partial) | Task 0 |
| **Interval 4** | Task 2 | Task 2 (Partial) | Task 1 |
| **... (Ellipsis)** | ... | ... | ... |
| **Interval N** | Task N-1 | (Idle) | (Idle) |
| **Interval N+1** | (Idle) | Task N-1 | Task N-2 |
| **Interval N+2** | (Idle) | (Idle) | Task N-1 |
*Note: The diagram shows a specific overlap where the start of WGMMA0 for iteration `i+1` coincides with the start of the Softmax for iteration `i`. However, WGMMA1 for iteration `i` starts only after Softmax for iteration `i` is complete.*
## 5. Summary of Data Points
* **Total Stages:** 3 (WGMMA0 -> Softmax -> WGMMA1).
* **Concurrency:** At peak execution (middle of the diagram), three different iterations are active simultaneously across the three functional units.
* **Total Iterations:** Represented as $0$ through $N-1$.