# Technical Document Extraction: Timeline Diagram Analysis
## Diagram Overview
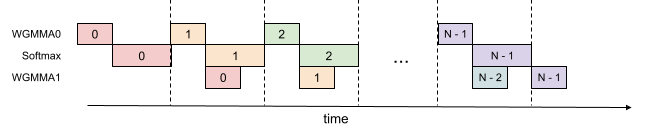
The image depicts a **timeline-based sequence diagram** with three parallel rows representing different components or processes. The horizontal axis is labeled **"time"** with dashed vertical lines segmenting the timeline into discrete intervals. Each row contains colored blocks with numerical labels, indicating state transitions or events over time.
---
## Key Components and Labels
### Axis and Segmentation
- **Horizontal Axis**: Labeled **"time"**, divided into segments by dashed vertical lines.
- **Vertical Rows**:
1. **WGMMA0** (top row)
2. **Softmax** (middle row)
3. **WGMMA1** (bottom row)
---
## Block Structure and Color Coding
Each row contains colored blocks with numerical labels. Colors and labels are consistent across rows but vary in position and sequence. Below is a breakdown:
### WGMMA0 (Top Row)
- **Block 1**: Pink (`#FFC0CB`), labeled **"0"**, spans the first time segment.
- **Block 2**: Orange (`#FFA500`), labeled **"1"**, spans the second time segment.
- **Block 3**: Green (`#90EE90`), labeled **"2"**, spans the third time segment.
- **Block 4**: Purple (`#B0C4DE`), labeled **"N-1"**, spans the fourth time segment.
### Softmax (Middle Row)
- **Block 1**: Pink (`#FFC0CB`), labeled **"0"**, spans the first time segment.
- **Block 2**: Orange (`#FFA500`), labeled **"1"**, spans the second time segment.
- **Block 3**: Green (`#90EE90`), labeled **"2"**, spans the third time segment.
- **Block 4**: Purple (`#B0C4DE`), labeled **"N-1"**, spans the fourth time segment.
### WGMMA1 (Bottom Row)
- **Block 1**: Orange (`#FFA500`), labeled **"0"**, spans the first time segment.
- **Block 2**: Green (`#90EE90`), labeled **"1"**, spans the second time segment.
- **Block 3**: Purple (`#B0C4DE`), labeled **"N-2"**, spans the third time segment.
- **Block 4**: Light Blue (`#ADD8E6`), labeled **"N-1"**, spans the fourth time segment.
---
## Observations
1. **Color Consistency**:
- Pink (`#FFC0CB`) is used for the initial state (`0`) in WGMMA0 and Softmax.
- Orange (`#FFA500`) represents state `1` in WGMMA0 and Softmax, and state `0` in WGMMA1.
- Green (`#90EE90`) denotes state `2` in WGMMA0 and Softmax, and state `1` in WGMMA1.
- Purple (`#B0C4DE`) corresponds to state `N-1` in WGMMA0 and Softmax, and state `N-2` in WGMMA1.
- Light Blue (`#ADD8E6`) is unique to WGMMA1 for state `N-1`.
2. **State Progression**:
- WGMMA0 and Softmax follow a similar progression: `0 → 1 → 2 → N-1`.
- WGMMA1 starts at `0`, increments to `1`, then jumps to `N-2` before `N-1`.
3. **Dashed Lines**: Segment the timeline into four distinct intervals, likely representing discrete time steps or phases.
---
## Data Table Reconstruction
| Time Segment | WGMMA0 | Softmax | WGMMA1 |
|--------------|--------|---------|--------|
| 1 | 0 | 0 | 0 |
| 2 | 1 | 1 | 1 |
| 3 | 2 | 2 | N-2 |
| 4 | N-1 | N-1 | N-1 |
---
## Notes
- **Legend**: No explicit legend is present, but color assignments are inferred from block labels and positions.
- **Ambiguity**: The meaning of `N` (e.g., total steps, sequence length) is not explicitly defined in the diagram.
- **Flow**: The diagram suggests parallel processing or synchronization between WGMMA0, Softmax, and WGMMA1, with state transitions aligned to time segments.
---
## Conclusion
This diagram illustrates a synchronized sequence of state transitions across three components (WGMMA0, Softmax, WGMMA1) over time. The use of color-coded blocks and numerical labels provides a visual representation of state progression, with WGMMA1 exhibiting a distinct pattern compared to the other two rows.