## Line Chart: Phi-3-mini-4k-Chat Loss vs. Epoch
### Overview
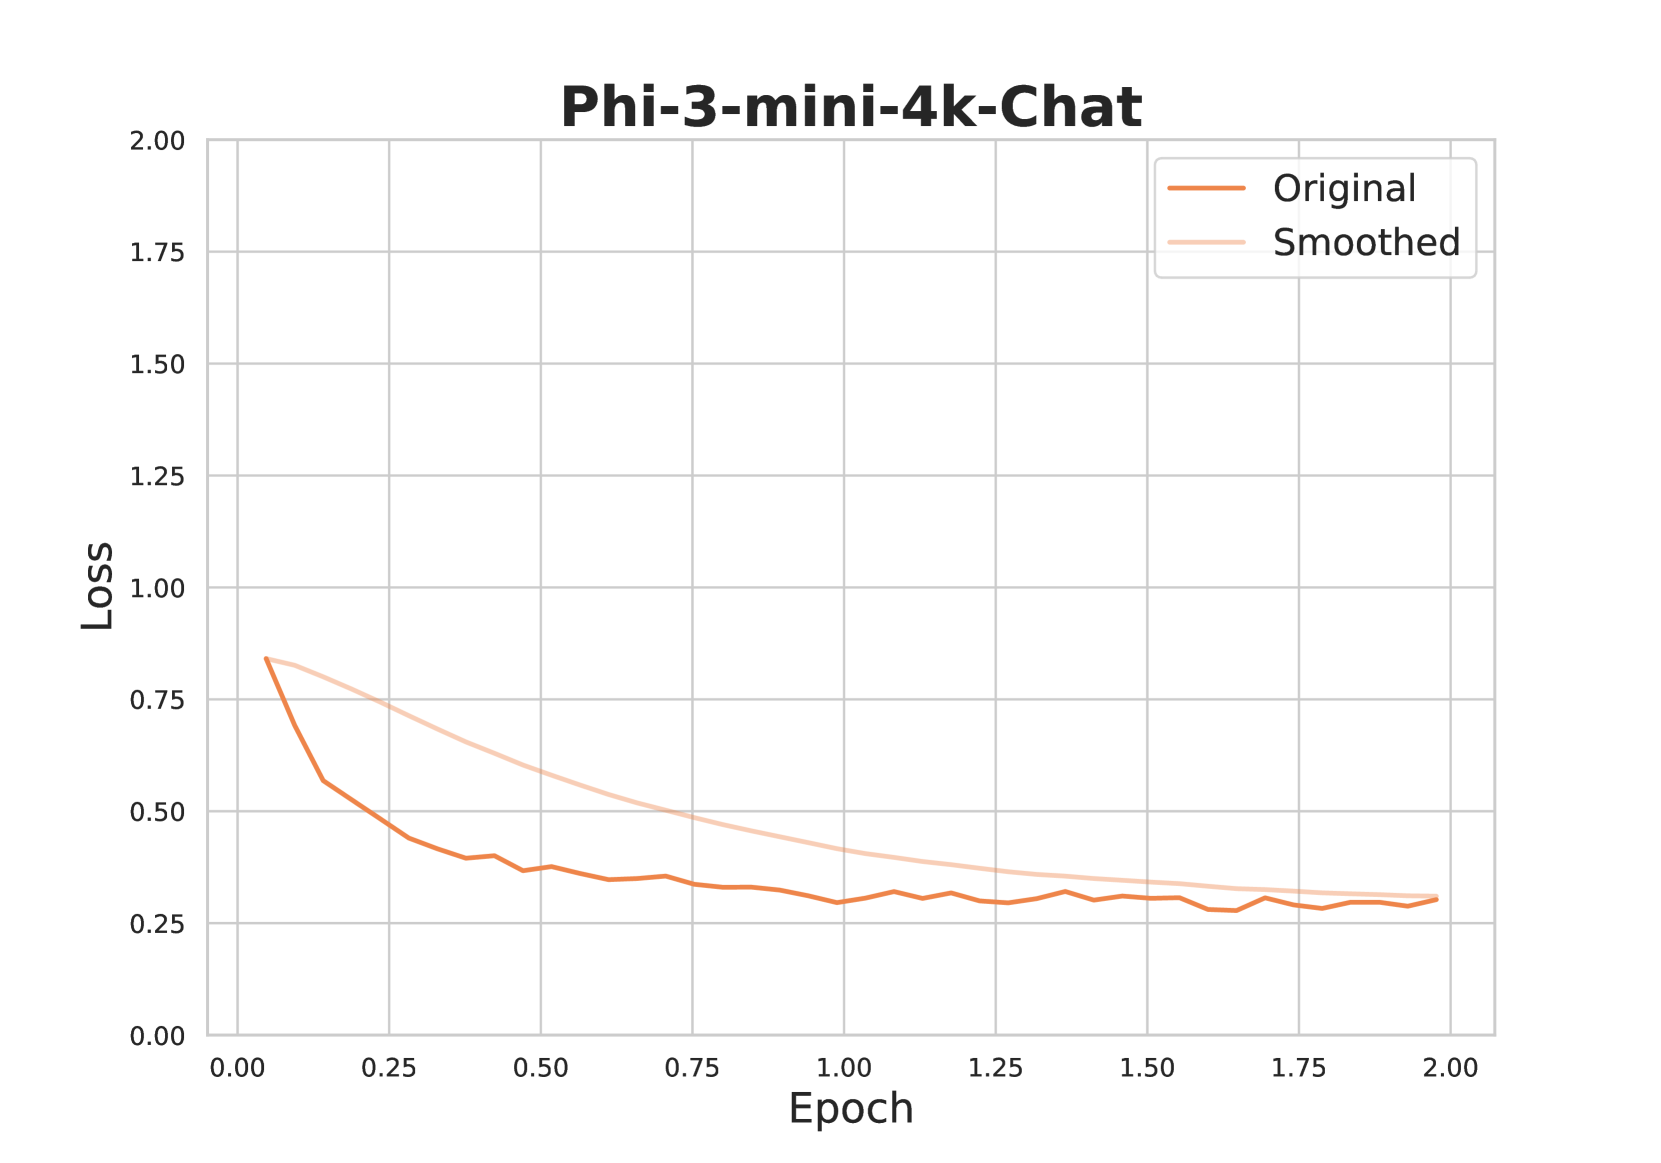
The image is a line chart displaying the loss of a model named "Phi-3-mini-4k-Chat" over epochs. Two lines are plotted: "Original" and "Smoothed". The chart shows how the loss decreases as the number of epochs increases.
### Components/Axes
* **Title:** Phi-3-mini-4k-Chat
* **X-axis:** Epoch, ranging from 0.00 to 2.00 in increments of 0.25.
* **Y-axis:** Loss, ranging from 0.00 to 2.00 in increments of 0.25.
* **Legend:** Located in the top-right corner.
* "Original" - represented by a solid dark orange line.
* "Smoothed" - represented by a light orange line.
### Detailed Analysis
* **Original (Dark Orange Line):**
* Trend: The line generally slopes downward, indicating a decrease in loss as the number of epochs increases. The decrease is more rapid in the initial epochs and gradually slows down.
* Data Points:
* Epoch 0.00: Loss ≈ 0.85
* Epoch 0.25: Loss ≈ 0.42
* Epoch 0.50: Loss ≈ 0.38
* Epoch 0.75: Loss ≈ 0.34
* Epoch 1.00: Loss ≈ 0.32
* Epoch 1.25: Loss ≈ 0.30
* Epoch 1.50: Loss ≈ 0.32
* Epoch 1.75: Loss ≈ 0.29
* Epoch 2.00: Loss ≈ 0.30
* **Smoothed (Light Orange Line):**
* Trend: The line slopes downward, similar to the "Original" line, but the decrease is smoother and less erratic.
* Data Points:
* Epoch 0.00: Loss ≈ 0.85
* Epoch 0.25: Loss ≈ 0.65
* Epoch 0.50: Loss ≈ 0.55
* Epoch 0.75: Loss ≈ 0.50
* Epoch 1.00: Loss ≈ 0.45
* Epoch 1.25: Loss ≈ 0.42
* Epoch 1.50: Loss ≈ 0.40
* Epoch 1.75: Loss ≈ 0.35
* Epoch 2.00: Loss ≈ 0.30
### Key Observations
* The "Original" line shows more fluctuation than the "Smoothed" line, indicating that the "Smoothed" line represents a moving average or some other smoothing technique applied to the original data.
* Both lines converge towards a loss value of approximately 0.30 as the number of epochs increases.
* The most significant decrease in loss occurs within the first 0.5 epochs.
### Interpretation
The chart illustrates the training progress of the "Phi-3-mini-4k-Chat" model. The decreasing loss values indicate that the model is learning and improving its performance as it is trained over multiple epochs. The "Smoothed" line provides a clearer view of the overall trend by reducing the noise present in the "Original" data. The convergence of both lines suggests that the model's learning rate might need adjustment after 1.5 epochs, as the loss reduction becomes minimal. The initial rapid decrease in loss highlights the importance of the early training stages.