## Line Chart: Phi-3-mini-4k-Chat Training Loss
### Overview
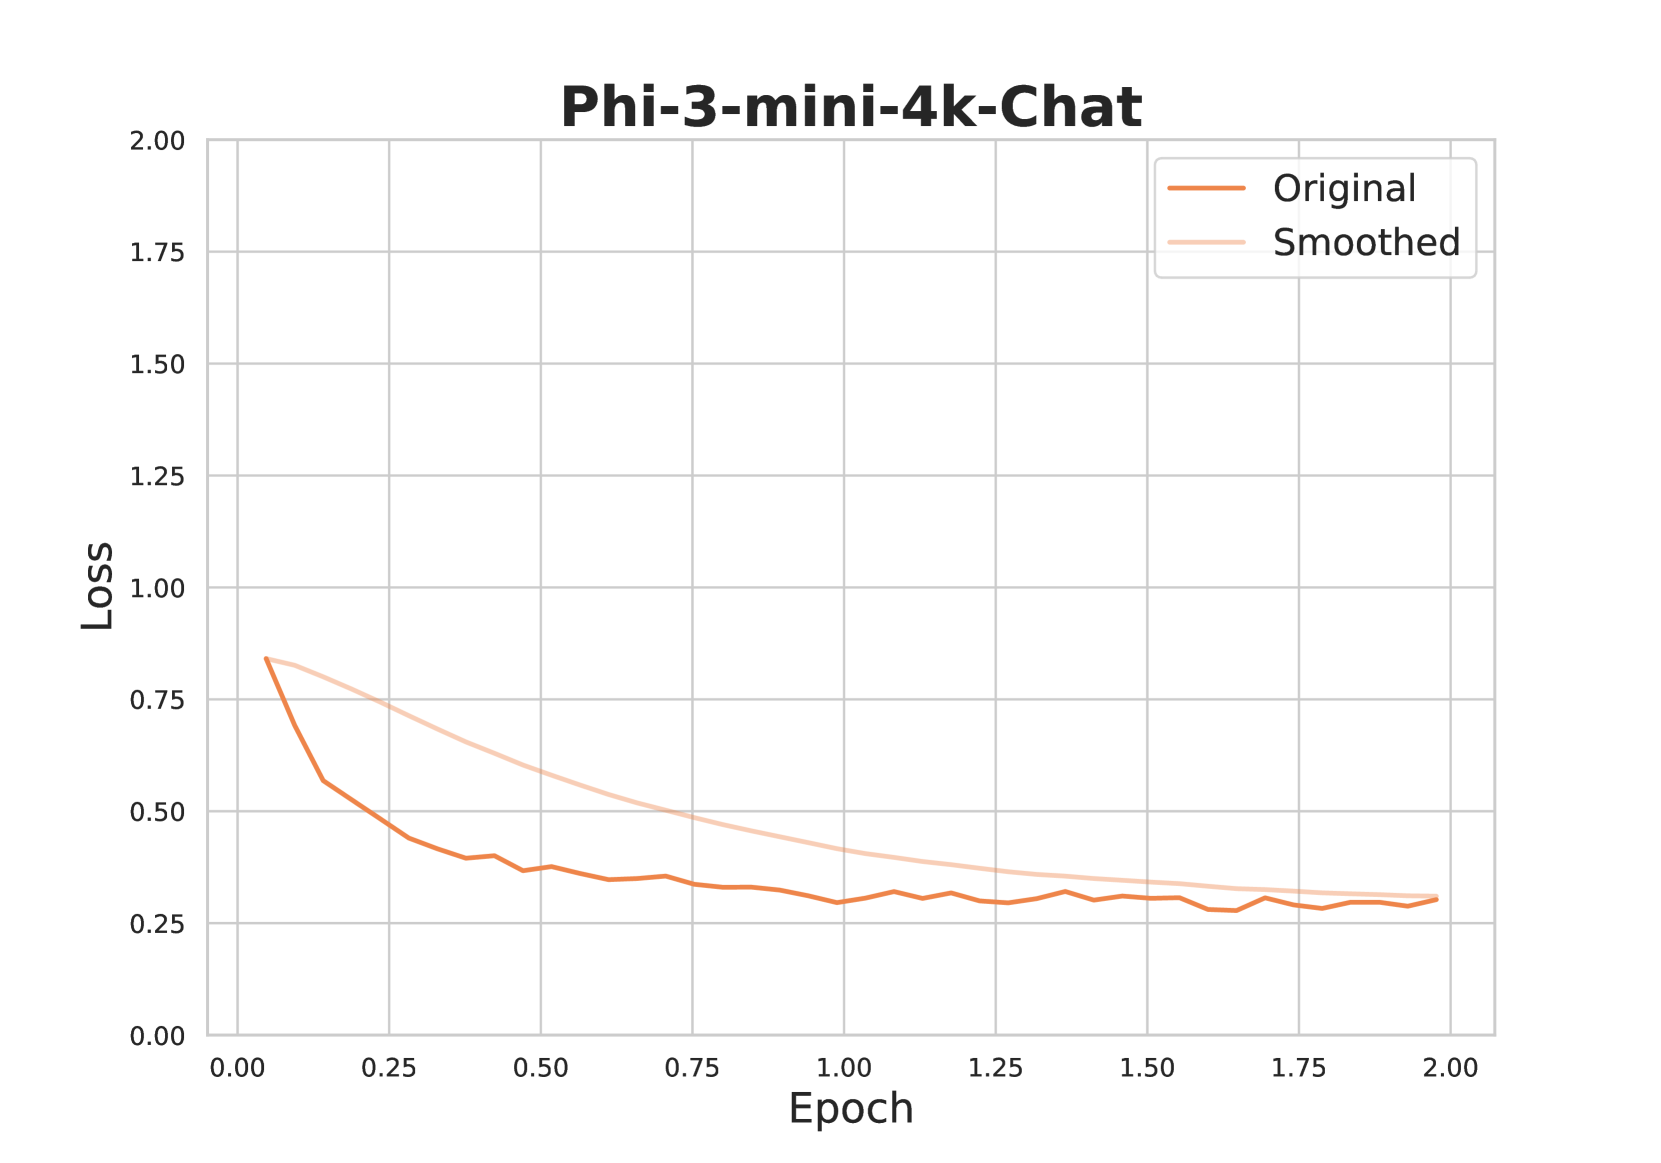
This image presents a line chart illustrating the training loss of a model named "Phi-3-mini-4k-Chat" over epochs. Two lines are plotted: "Original" loss and "Smoothed" loss. The chart aims to visualize how the model's loss decreases during training, with the smoothed line representing a trendline.
### Components/Axes
* **Title:** Phi-3-mini-4k-Chat (positioned at the top-center)
* **X-axis:** Epoch (ranging from approximately 0.00 to 2.00, with tick marks at 0.25 intervals)
* **Y-axis:** Loss (ranging from approximately 0.00 to 2.00, with tick marks at 0.25 intervals)
* **Legend:** Located in the top-right corner.
* "Original" - represented by an orange line.
* "Smoothed" - represented by a light-grey line.
### Detailed Analysis
**Original Loss (Orange Line):**
The "Original" loss line starts at approximately 0.75 at Epoch 0.00. It exhibits a steep downward trend until approximately Epoch 0.25, reaching a loss of around 0.40. From Epoch 0.25 to Epoch 1.00, the line continues to decrease, but at a slower rate, reaching a loss of approximately 0.25. Between Epoch 1.00 and Epoch 2.00, the line fluctuates around 0.25, with minor oscillations. Specific data points (approximate):
* Epoch 0.00: Loss = 0.75
* Epoch 0.25: Loss = 0.40
* Epoch 0.50: Loss = 0.32
* Epoch 0.75: Loss = 0.28
* Epoch 1.00: Loss = 0.25
* Epoch 1.25: Loss = 0.26
* Epoch 1.50: Loss = 0.24
* Epoch 1.75: Loss = 0.27
* Epoch 2.00: Loss = 0.26
**Smoothed Loss (Light-Grey Line):**
The "Smoothed" loss line begins at approximately 0.75 at Epoch 0.00. It shows a consistent downward trend, though less erratic than the "Original" line. The smoothed line reaches a loss of approximately 0.25 by Epoch 1.00 and remains relatively stable around that value until Epoch 2.00. Specific data points (approximate):
* Epoch 0.00: Loss = 0.75
* Epoch 0.25: Loss = 0.55
* Epoch 0.50: Loss = 0.40
* Epoch 0.75: Loss = 0.32
* Epoch 1.00: Loss = 0.25
* Epoch 1.25: Loss = 0.24
* Epoch 1.50: Loss = 0.24
* Epoch 1.75: Loss = 0.25
* Epoch 2.00: Loss = 0.25
### Key Observations
* Both the "Original" and "Smoothed" loss curves demonstrate a decreasing trend, indicating that the model is learning and improving over epochs.
* The "Smoothed" line provides a clearer visualization of the overall loss trend, filtering out some of the noise present in the "Original" loss curve.
* The "Original" loss exhibits more fluctuations, suggesting that the training process is not perfectly smooth and may be sensitive to individual batches of data.
* The loss appears to converge around a value of 0.25 after approximately 1.0 epoch.
### Interpretation
The chart suggests that the "Phi-3-mini-4k-Chat" model is successfully being trained, as evidenced by the decreasing loss values. The smoothing of the loss curve indicates that the model's performance is stabilizing over time. The convergence of the loss around 0.25 suggests that the model has reached a point of diminishing returns, where further training may not significantly improve its performance. The fluctuations in the "Original" loss curve could be due to the stochastic nature of the training process, or potentially indicate the need for adjustments to the learning rate or other hyperparameters. The difference between the original and smoothed loss shows the variance in the training process. The smoothed loss is a good indicator of the overall trend, while the original loss shows the actual performance at each epoch.