## Line Chart: Phi-3-mini-4k-Chat Loss Over Epochs
### Overview
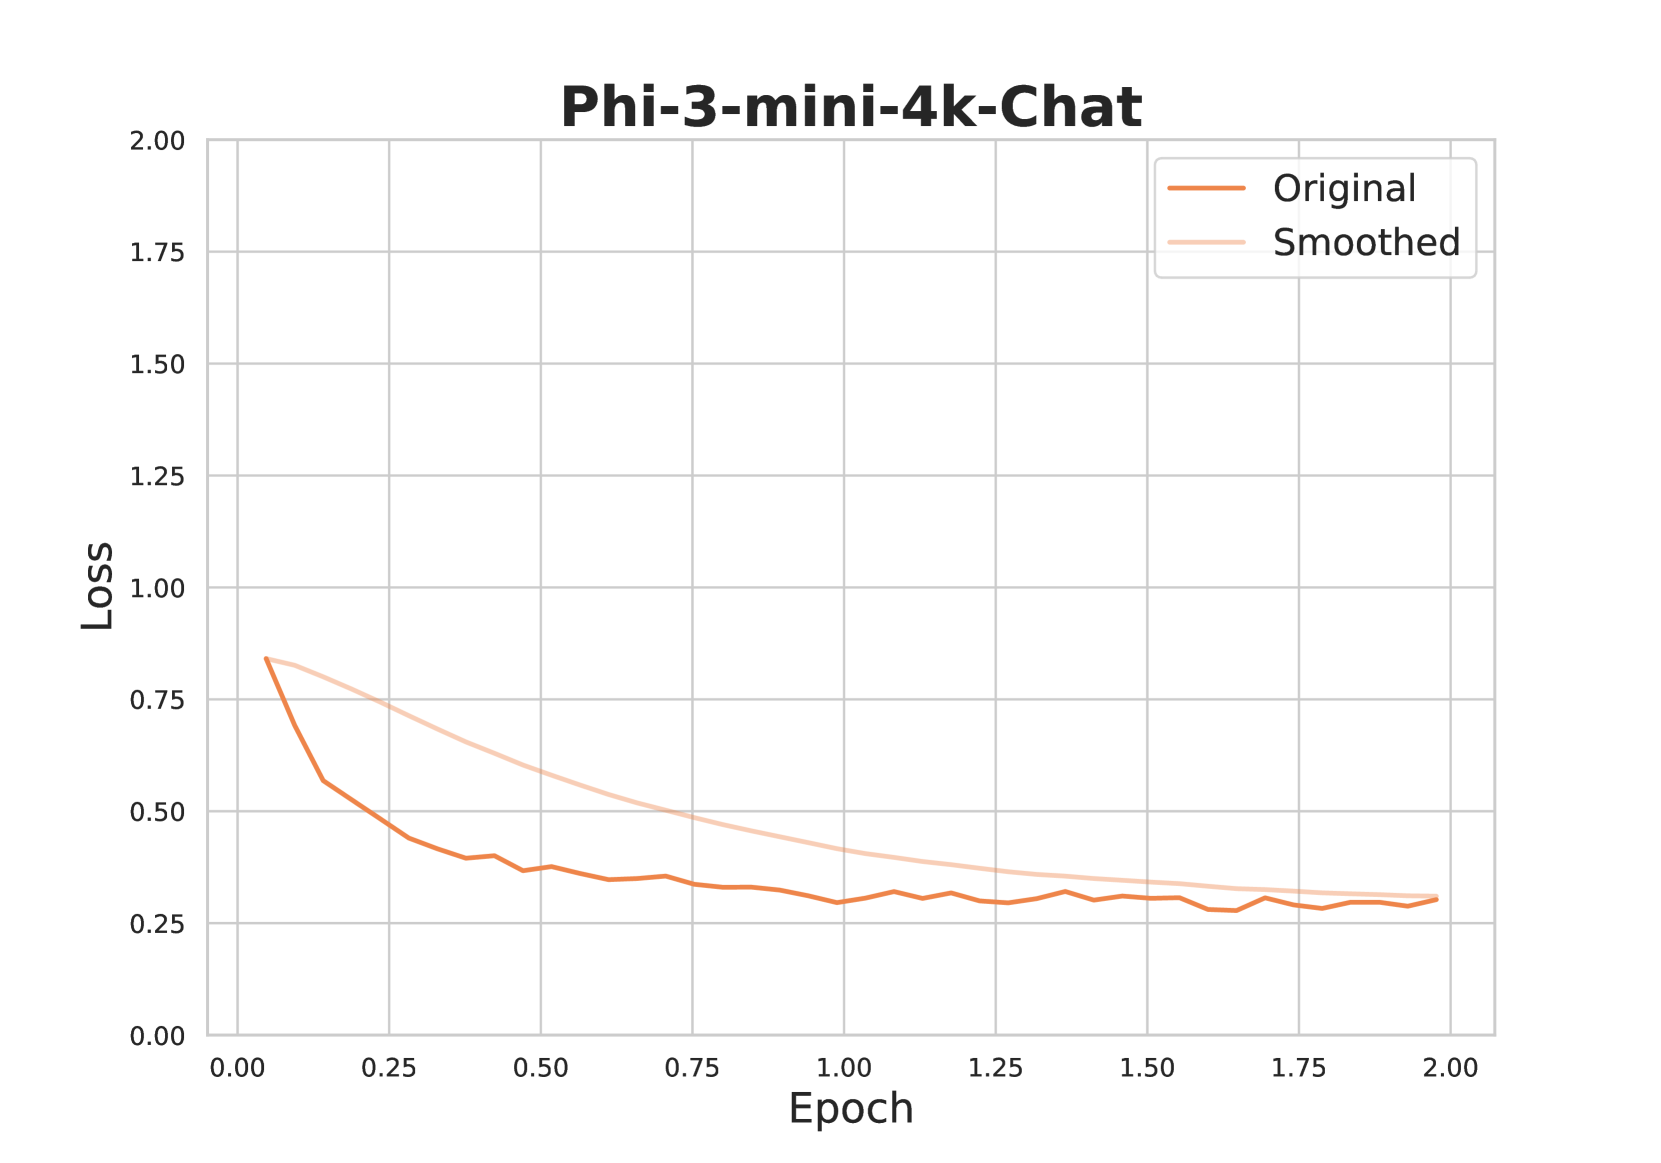
The chart visualizes the loss reduction of two model configurations ("Original" and "Smoothed") over 2.00 training epochs. Both lines show a downward trend, with the "Smoothed" line exhibiting less fluctuation than the "Original" line.
### Components/Axes
- **X-axis (Epoch)**: Ranges from 0.00 to 2.00 in increments of 0.25.
- **Y-axis (Loss)**: Ranges from 0.00 to 2.00 in increments of 0.25.
- **Legend**: Located in the top-right corner, with:
- **Orange line**: "Original" model
- **Light orange line**: "Smoothed" model
### Detailed Analysis
1. **Original Line (Orange)**:
- Starts at ~0.8 loss at epoch 0.00.
- Decreases to ~0.3 loss by epoch 2.00.
- Exhibits minor fluctuations (e.g., slight dips at epochs 0.50 and 1.25).
- Average slope: ~-0.25 loss per epoch.
2. **Smoothed Line (Light Orange)**:
- Starts at ~0.85 loss at epoch 0.00.
- Decreases to ~0.35 loss by epoch 2.00.
- Maintains a smoother trajectory with no sharp fluctuations.
- Average slope: ~-0.275 loss per epoch.
3. **Convergence**:
- Both lines converge near epoch 2.00, with the "Smoothed" line ending slightly higher (~0.35 vs. ~0.3).
### Key Observations
- The "Smoothed" line demonstrates reduced volatility, suggesting improved stability in loss tracking.
- Both models achieve ~65-70% loss reduction over 2 epochs.
- Early epochs (0.00–0.50) show the steepest decline for both lines.
### Interpretation
The "Smoothed" line’s reduced fluctuations imply that smoothing techniques effectively filter noise, providing a clearer view of the underlying trend. The convergence at epoch 2.00 suggests both configurations reach similar performance levels by the end of training. The "Original" line’s minor fluctuations may indicate transient instability during training, which smoothing mitigates. This aligns with common practices in machine learning where smoothing aids in diagnosing model behavior without overfitting to noise.