## Chart: Confidence vs. Target Length in High School Physics
### Overview
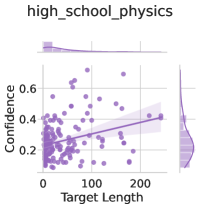
The image is a scatter plot showing the relationship between "Confidence" and "Target Length" in the context of "high_school_physics". The plot includes marginal distributions (histograms/density plots) for each variable along the axes. A regression line with a confidence interval is overlaid on the scatter plot.
### Components/Axes
* **Title:** high\_school\_physics
* **X-axis:** Target Length
* Scale: 0 to approximately 200
* **Y-axis:** Confidence
* Scale: 0 to approximately 0.6
* **Marginal Distributions:**
* Top: Distribution of Target Length
* Right: Distribution of Confidence
* **Data Points:** Each point represents a data entry, with its position determined by its Target Length and Confidence values.
* **Regression Line:** A line of best fit through the data points, with a shaded confidence interval around it.
* **Color:** The color of the data points, regression line, and marginal distributions is a light purple.
### Detailed Analysis
* **Target Length:**
* Range: Approximately 0 to 200
* Distribution: Skewed right, with a high concentration of values near 0.
* **Confidence:**
* Range: Approximately 0 to 0.6
* Distribution: Bimodal, with peaks around 0.2 and 0.4.
* **Scatter Plot:**
* The data points are scattered, but there appears to be a slight positive correlation between Target Length and Confidence.
* Most data points are clustered near the lower left corner of the plot, indicating low Target Length and low Confidence.
* **Regression Line:**
* The regression line slopes upward, indicating a positive relationship between Target Length and Confidence.
* The confidence interval around the regression line widens as Target Length increases, suggesting greater uncertainty in the relationship at higher Target Length values.
### Key Observations
* There is a weak positive correlation between Target Length and Confidence.
* Most data points have low Target Length and low Confidence.
* The uncertainty in the relationship between Target Length and Confidence increases as Target Length increases.
### Interpretation
The plot suggests that, in the context of high school physics, there is a slight tendency for confidence to increase as the target length increases. However, the relationship is weak, and there is considerable variability in the data. The clustering of data points at low Target Length and low Confidence suggests that many instances involve short targets and low confidence. The widening confidence interval at higher Target Length values indicates that the relationship between Target Length and Confidence is less certain for longer targets. This could be due to a variety of factors, such as the complexity of the targets or the difficulty of assessing confidence for longer targets.