## Scatter Plot with Regression: High School Physics Confidence vs. Target Length
### Overview
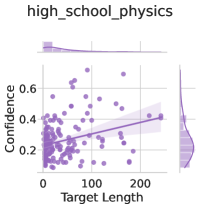
The image is a scatter plot titled "high_school_physics" that visualizes the relationship between "Target Length" (x-axis) and "Confidence" (y-axis). It includes a fitted regression line with a shaded confidence interval. The plot appears to be generated by a statistical or data visualization library (e.g., Seaborn in Python).
### Components/Axes
* **Title:** "high_school_physics" (centered at the top).
* **X-Axis:**
* **Label:** "Target Length" (centered below the axis).
* **Scale:** Linear scale from 0 to approximately 250.
* **Major Tick Marks:** 0, 100, 200.
* **Y-Axis:**
* **Label:** "Confidence" (centered to the left, rotated 90 degrees).
* **Scale:** Linear scale from approximately 0.1 to 0.7.
* **Major Tick Marks:** 0.2, 0.4, 0.6.
* **Data Series:**
* **Scatter Points:** Numerous small, semi-transparent purple circles representing individual data points.
* **Trend Line:** A solid, darker purple line representing a linear regression fit.
* **Confidence Interval:** A lighter purple shaded region surrounding the trend line, indicating the uncertainty of the fit.
* **Marginal Distributions:** Faint, semi-transparent purple density plots (histograms/KDEs) are visible along the top (for Target Length) and right side (for Confidence) of the main plot area, showing the distribution of each variable independently.
### Detailed Analysis
* **Data Distribution:**
* The majority of data points are clustered in the lower-left quadrant of the plot, specifically where **Target Length is between 0 and 100** and **Confidence is between 0.2 and 0.4**.
* There is a high density of points near the origin (low Target Length, low Confidence).
* Data becomes sparser as Target Length increases beyond 100.
* **Trend Line & Relationship:**
* The regression line shows a **slight positive slope**. It originates at approximately **(Target Length=0, Confidence=0.25)** and ends near **(Target Length=200, Confidence=0.4)**.
* This indicates a **weak positive correlation**: as the Target Length increases, the Confidence score tends to increase slightly.
* The shaded confidence interval around the line is narrow at low Target Lengths (where data is dense) and widens significantly as Target Length increases (where data is sparse), indicating greater uncertainty in the trend for longer targets.
* **Outliers & Spread:**
* Several points exhibit **high Confidence (>0.5)**, primarily occurring at **Target Lengths between ~30 and 120**.
* The highest visible Confidence value is approximately **0.65**, occurring at a Target Length of roughly 50.
* For any given Target Length, there is substantial vertical spread in Confidence values, suggesting other factors beyond length influence confidence.
### Key Observations
1. **Cluster Dominance:** The visual narrative is dominated by a dense cluster of points representing short-to-medium length targets with low-to-moderate confidence.
2. **Positive but Noisy Trend:** While the overall trend is positive, the relationship is noisy with high variance, especially at longer target lengths.
3. **Asymmetric Uncertainty:** The model's confidence in its own trend (the shaded CI) is much lower for predictions about longer target lengths due to sparse data.
4. **Absence of Very Low Confidence:** There are virtually no data points with Confidence below ~0.15, suggesting a baseline level of confidence in the model or measurement.
### Interpretation
This plot likely analyzes the performance of an AI model or a scoring system on high school physics problems. "Target Length" probably refers to the length of the expected answer or solution step, while "Confidence" is the model's self-assessed probability of being correct.
The data suggests that the system is **more confident when dealing with shorter, likely simpler, physics problems**. The weak positive correlation is counter-intuitive at first glance—one might expect longer, more complex answers to correlate with lower confidence. However, this could indicate that:
* Longer answers are required for more straightforward, procedural problems where the model can follow a known algorithm step-by-step, leading to higher confidence.
* The model's confidence calibration is imperfect, as it shows high confidence even for some medium-length answers where the actual accuracy might be variable (evidenced by the vertical spread).
* The sparse data for very long answers (>200) makes any conclusion about the model's behavior on extremely complex problems unreliable.
The marginal distributions confirm that most problems in this dataset have short answer lengths and moderate confidence scores. The plot serves as a diagnostic tool, highlighting that while a general trend exists, the model's confidence is highly variable and should not be solely relied upon, especially for longer-form responses where data is limited.