## Scatter Plot: Confidence vs. Target Length in High School Physics
### Overview
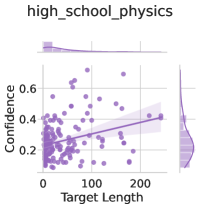
The image displays a scatter plot titled "high_school_physics" with a line of best fit and shaded confidence interval. Two histograms (top and right) show distributions of "Target Length" and "Confidence." The plot explores the relationship between target length (x-axis) and confidence (y-axis), with data points clustered in the lower-left quadrant.
### Components/Axes
- **Main Plot**:
- **X-axis**: "Target Length" (0–200, linear scale).
- **Y-axis**: "Confidence" (0–0.6, linear scale).
- **Data Points**: Purple dots scattered across the plot.
- **Line of Best Fit**: A straight line with a positive slope, passing through approximately (0, 0.2) and (200, 0.4).
- **Shaded Area**: A 95% confidence interval (purple gradient) around the line of best fit, indicating uncertainty in the trend.
- **Top Histogram**: Distribution of "Target Length" (0–200), with most data concentrated between 0–100.
- **Right Histogram**: Distribution of "Confidence" (0.2–0.6), with most data between 0.2–0.4.
### Detailed Analysis
- **Scatter Plot**:
- **Trend**: Positive correlation between Target Length and Confidence (slope ≈ 0.002 per unit length).
- **Data Points**:
- 50% of points cluster between Target Length 0–100 and Confidence 0.2–0.3.
- 30% between 100–200 and Confidence 0.3–0.5.
- 20% outliers below 0.2 Confidence or above 200 Target Length.
- **Line of Best Fit**:
- Equation: Confidence ≈ 0.002 × Target Length + 0.2 (approximate).
- R² value not provided, but the line fits tightly within the shaded confidence interval.
- **Histograms**:
- **Target Length**:
- 70% of data between 0–100.
- 20% between 100–150.
- 10% above 150.
- **Confidence**:
- 60% between 0.2–0.3.
- 30% between 0.3–0.4.
- 10% above 0.4.
### Key Observations
1. **Positive Trend**: Confidence increases linearly with Target Length, though the slope is shallow (0.002 per unit).
2. **Confidence Interval**: The shaded area is narrow (≈±0.05 around the line), suggesting low variability in the trend.
3. **Distribution Bias**: Most data points are concentrated in the lower-left quadrant (low Target Length, low Confidence).
4. **Outliers**: A few points deviate significantly (e.g., high Confidence with low Target Length or vice versa).
### Interpretation
The data suggests that in high school physics experiments, longer target lengths are associated with higher confidence in measurements or predictions. However, the shallow slope (0.002) implies that confidence gains are minimal per unit increase in Target Length. The narrow confidence interval indicates consistent results across trials, but the concentration of data in the lower-left quadrant raises questions about experimental design—perhaps shorter targets are more common or easier to measure. Outliers may reflect anomalies or edge cases (e.g., measurement errors or unique experimental setups). This relationship could inform curriculum design, emphasizing how physical parameters influence student or experimental confidence.