## Chart: Training and Testing Accuracy vs. Epoch
### Overview
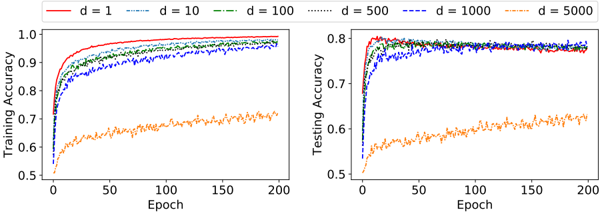
The image presents two line charts side-by-side, comparing the training accuracy (left) and testing accuracy (right) of a model across 200 epochs. Different lines represent different values of 'd' (likely a hyperparameter), ranging from 1 to 5000. The charts illustrate how the accuracy changes with the number of epochs for each 'd' value.
### Components/Axes
**Left Chart (Training Accuracy):**
* **Y-axis:** "Training Accuracy", ranging from 0.5 to 1.0 in increments of 0.1.
* **X-axis:** "Epoch", ranging from 0 to 200 in increments of 50.
* **Legend:** Located at the top of the image.
* Red line: d = 1
* Blue dashed line: d = 10
* Green dash-dot line: d = 100
* Black dotted line: d = 500
* Dark Blue dash-dot-dot line: d = 1000
* Orange dash-dot line: d = 5000
**Right Chart (Testing Accuracy):**
* **Y-axis:** "Testing Accuracy", ranging from 0.5 to 0.8 in increments of 0.1.
* **X-axis:** "Epoch", ranging from 0 to 200 in increments of 50.
* **Legend:** (Same as left chart) Located at the top of the image.
* Red line: d = 1
* Blue dashed line: d = 10
* Green dash-dot line: d = 100
* Black dotted line: d = 500
* Dark Blue dash-dot-dot line: d = 1000
* Orange dash-dot line: d = 5000
### Detailed Analysis
**Left Chart (Training Accuracy):**
* **d = 1 (Red):** Starts at approximately 0.75 accuracy and rapidly increases, plateauing near 1.0 after about 50 epochs.
* **d = 10 (Blue Dashed):** Starts at approximately 0.55 accuracy and increases, plateauing around 0.95 after about 75 epochs.
* **d = 100 (Green Dash-Dot):** Starts at approximately 0.65 accuracy and increases, plateauing around 0.97 after about 75 epochs.
* **d = 500 (Black Dotted):** Starts at approximately 0.7 accuracy and increases, plateauing around 0.97 after about 75 epochs.
* **d = 1000 (Dark Blue Dash-Dot-Dot):** Starts at approximately 0.7 accuracy and increases, plateauing around 0.95 after about 75 epochs.
* **d = 5000 (Orange Dash-Dot):** Starts at approximately 0.5 accuracy and increases slowly, reaching approximately 0.72 accuracy after 200 epochs.
**Right Chart (Testing Accuracy):**
* **d = 1 (Red):** Starts at approximately 0.7 accuracy and increases, plateauing around 0.78 after about 50 epochs.
* **d = 10 (Blue Dashed):** Starts at approximately 0.5 accuracy and increases, plateauing around 0.75 after about 75 epochs.
* **d = 100 (Green Dash-Dot):** Starts at approximately 0.6 accuracy and increases, plateauing around 0.78 after about 75 epochs.
* **d = 500 (Black Dotted):** Starts at approximately 0.65 accuracy and increases, plateauing around 0.78 after about 75 epochs.
* **d = 1000 (Dark Blue Dash-Dot-Dot):** Starts at approximately 0.65 accuracy and increases, plateauing around 0.75 after about 75 epochs.
* **d = 5000 (Orange Dash-Dot):** Starts at approximately 0.5 accuracy and increases slowly, reaching approximately 0.62 accuracy after 200 epochs.
### Key Observations
* For training accuracy, d = 1 achieves the highest accuracy, closely followed by d = 100 and d = 500. d = 5000 performs the worst.
* For testing accuracy, d = 1, d = 100, and d = 500 perform similarly, achieving the highest accuracy. d = 5000 performs the worst.
* The training accuracy generally plateaus after approximately 50-75 epochs for d values 1, 10, 100, 500, and 1000.
* The testing accuracy also plateaus after approximately 50-75 epochs for d values 1, 10, 100, 500, and 1000.
* The model with d = 5000 shows significantly lower accuracy in both training and testing sets compared to other d values.
### Interpretation
The charts suggest that the hyperparameter 'd' significantly impacts model performance. Lower values of 'd' (1, 100, 500) lead to higher training and testing accuracy, indicating a better fit for the data. The value d = 5000 results in underfitting, as the model fails to achieve high accuracy on either the training or testing sets. The similar performance of d = 1, d = 100, and d = 500 on the testing set suggests that increasing 'd' beyond a certain point does not improve generalization and may even hinder it. The plateauing of accuracy after a certain number of epochs indicates that further training does not significantly improve the model's performance, suggesting an optimal point for stopping the training process.