## Line Graphs: Training and Testing Accuracy vs. Epochs
### Overview
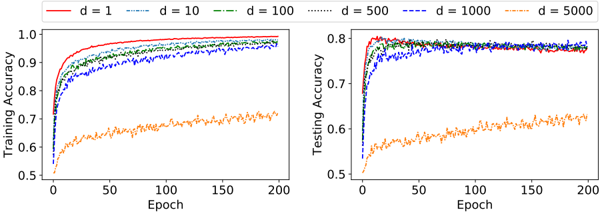
The image contains two side-by-side line graphs comparing training and testing accuracy across different model dimensions (`d`). Each graph tracks performance over 200 epochs, with accuracy ranging from 0.5 to 1.0. The graphs use color-coded lines to represent six `d` values: 1, 10, 100, 500, 1000, and 5000.
### Components/Axes
- **Left Graph (Training Accuracy)**:
- **X-axis**: Epoch (0 to 200, linear scale).
- **Y-axis**: Training Accuracy (0.5 to 1.0, linear scale).
- **Legend**: Located at the top-right, mapping colors to `d` values:
- Red: `d = 1`
- Blue: `d = 10`
- Green: `d = 100`
- Dotted green: `d = 500`
- Dotted blue: `d = 1000`
- Orange: `d = 5000`
- **Right Graph (Testing Accuracy)**:
- **X-axis**: Epoch (0 to 200, linear scale).
- **Y-axis**: Testing Accuracy (0.5 to 0.8, linear scale).
- **Legend**: Same as the left graph, positioned at the top-right.
### Detailed Analysis
#### Training Accuracy (Left Graph)
- **Trends**:
- All lines (except `d = 5000`) rapidly converge to ~0.95–1.0 by epoch 50–100.
- `d = 5000` (orange) remains flat at ~0.6–0.7 throughout, with minor fluctuations.
- Lines for `d = 1`, `d = 10`, and `d = 100` show slight divergence in early epochs but stabilize.
- **Key Data Points**:
- `d = 1` (red): Peaks at ~0.98 by epoch 50.
- `d = 5000` (orange): Stays at ~0.65–0.70 across all epochs.
#### Testing Accuracy (Right Graph)
- **Trends**:
- Lines for `d = 1`, `d = 10`, and `d = 100` plateau near ~0.75–0.80 by epoch 50.
- `d = 500`, `d = 1000`, and `d = 5000` show similar performance, hovering between ~0.70–0.75.
- `d = 5000` (orange) again lags, reaching ~0.60–0.65 by epoch 200.
- **Key Data Points**:
- `d = 100` (green): Peaks at ~0.78 by epoch 50.
- `d = 5000` (orange): Remains at ~0.60–0.65 throughout.
### Key Observations
1. **Convergence of Higher `d` Values**: Models with `d ≥ 100` achieve near-identical training and testing accuracy, suggesting diminishing returns beyond this threshold.
2. **Performance Gap for `d = 5000`**: The orange line (`d = 5000`) underperforms in both training and testing, indicating potential overfitting or instability at extreme dimensions.
3. **Early Epoch Behavior**: All models except `d = 5000` show rapid improvement in the first 50–100 epochs, followed by stabilization.
### Interpretation
The graphs demonstrate that increasing model dimensionality (`d`) improves performance up to a point (`d = 100`), after which further increases yield negligible gains. The drastic drop in performance for `d = 5000` suggests that excessively high dimensions may introduce noise or overfitting, reducing generalization. This aligns with common machine learning principles where model complexity must balance with data capacity. The testing accuracy plateau near 0.75–0.80 implies a practical upper bound for this dataset, regardless of `d` beyond 100.